HTC 2008 Annual Report Download - page 90
Download and view the complete annual report
Please find page 90 of the 2008 HTC annual report below. You can navigate through the pages in the report by either clicking on the pages listed below, or by using the keyword search tool below to find specific information within the annual report.-
 1
1 -
2
-
3
-
4
-
5
-
6
-
7
-
8
-
9
-
10
-
11
-
12
-
13
-
14
-
15
-
16
-
17
-
18
-
19
-
20
-
21
-
22
-
23
-
24
-
25
-
26
-
27
-
28
-
29
-
30
-
31
-
32
-
33
-
34
-
35
-
36
-
37
-
38
-
39
-
40
-
41
-
42
-
43
-
44
-
45
-
46
-
47
-
48
-
49
-
50
-
51
-
52
-
53
-
54
-
55
-
56
-
57
-
58
-
59
-
60
-
61
-
62
-
63
-
64
-
65
-
66
-
67
-
68
-
69
-
70
-
71
-
72
-
73
-
74
-
75
-
76
-
77
-
78
-
79
-
 80
80 -
 81
81 -
 82
82 -
 83
83 -
 84
84 -
 85
85 -
 86
86 -
 87
87 -
 88
88 -
 89
89 -
 90
90 -
 91
91 -
 92
92 -
 93
93 -
 94
94 -
 95
95 -
 96
96 -
 97
97 -
 98
98 -
 99
99 -
 100
100 -
101
-
102
-
103
-
104
-
105
-
106
-
107
-
108
-
109
-
110
-
111
-
112
-
113
-
114
-
115
-
116
-
117
-
118
-
119
-
120
-
121
-
122
-
123
-
124
 |
 |

Financial Information
| 45
44 |
2008 Annual Report
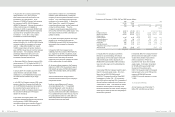
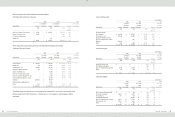
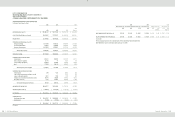
the shares at the balance sheet date. Such
dilutive effects of the potential shares needs to be
included in the calculation of diluted EPS until the
stockholders resolve the number of shares to be
distributed to employees at their meeting in the
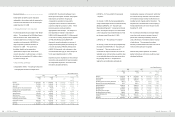
following year. The related EPS information for
the years ended December 31, 2006, 2007 and
2008 are as follows:
2006
Numerators
Denominator
EPS (In Dollars)
Income before Income Tax
Income after Income Tax
Shares (Thousands)
Income before
Income Tax
Income after
Income Tax
NT$
NT$
NT$
NT$
Basic EPS
$26,957,878
$25,247,327
761,697
$35.39
$33.15
Employee stock options
-
-
6,763
Diluted EPS
$26,957,878
$25,247,327
768,460
$35.08
$32.85
2007
Numerators
Denominator
EPS (In Dollars)
Income before Income Tax
Income after Income Tax
Shares (Thousands)
Income before
Income Tax
Income after
Income Tax
NT$
NT$
NT$
NT$
Basic EPS
$32,151,297
$28,938,862
755,608
$42.55
$38.30
Employee stock options
-
-
-
Diluted EPS
$32,151,297
$28,938,862
755,608
$42.55
$38.30
2008
Numerators
Denominator
EPS (In Dollars)
Income before Income Tax
Income after Income Tax
Shares (Thousands)
Income before
Income Tax
Income after
Income Tax
NT$
NT$
NT$
NT$
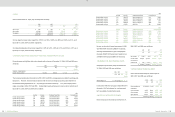
Basic EPS
$31,590,479
$28,635,349
754,148
$41.89
$37.97
Bonus to employees
-
-
27,400
Diluted EPS
$31,590,479
$28,635,349
781,548
$40.42
$36.64
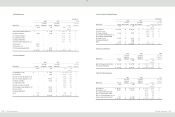
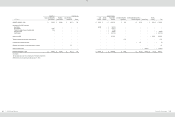
2008
Numerators
Denominator
EPS (In Dollars)
Income before Income Tax
Income after Income Tax
Shares (Thousands)
Income before
Income Tax
Income after
Income Tax
US$
US$
US$
US$
(Note 3)
(Note 3)
(Note 3)
(Note 3)
Basic EPS
$963,125
$873,029
754,148
$1.28
$1.16
Employees’ bonus
-
-
27,400
Diluted EPS
$963,125
$873,029
781,548
$1.23
$1.12
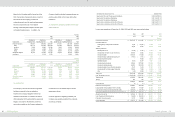
24.FINANCIAL INSTRUMENTS
Fair Value of Financial Instruments
>Nonderivative Financial Instruments
December 31
2006
2007
2008
Carrying
Amount
Fair
Value
Carrying
Amount
Fair
Value
Carrying
Amount
Fair
Value
NT$
NT$
NT$
NT$
NT$
US$
NT$
US$
(Note 3)
(Note 3)
Assets
Available-for-sale financial assets -
noncurrent
$
1,733
$
1,733
$
784
$
784
$
339
$
10
$
339
$
10
Financial assets carried at cost
1,192
1,192
501,192
501,192
501,192
15,280
501,192
15,280
Bond investments not quoted in an active
market
-
-
33,030
33,030
-
-
-
-
Investments accounted for by the equity
method
821,556
821,556
2,397,133
2,397,133
4,659,360
142,054
4,659,360
142,054
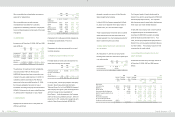
>Derivative Financial Instruments
December 31
2006
2007
2008
Carrying
Amount
Fair
Value
Carrying
Amount
Fair
Value
Carrying
Amount
Fair
Value
NT$
NT$
NT$
NT$
NT$
US$
NT$
US$
(Note 3)
(Note 3)
Liabilities
Financial liabilities at fair value
through profit or loss
76,470
76,470
96,256
96,256
514,083
15,673
514,083
15,673
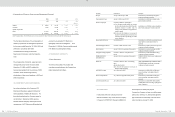
Methods and Assumptions Used in
Determining Fair Values of Financial
Instruments
Not subject to Statement of Financial Accounting
Standards No. 34 - “Financial Instruments:
Recognition and Measurement” are cash,
receivables, other current financial assets,
payables, accrued expenses and other current
financial liabilities, which have carrying amounts
that approximate their fair values.
The financial instruments neither include
refundable deposits nor guarantee deposits. The
fair values of refundable deposits and guarantee
deposits received are based on the present value
of future cash flows discounted at the average
interest rates for time deposits with maturities
similar to those of the financial instruments.
The fair values of financial instruments at fair value
through profit or loss and available-for-sale
financial assets are based on quoted market prices
in an active market, and their fair values can be
reliably measured. If the securities do not have
market prices, fair value is measured on the basis
of financial or other information. The Company