HTC 2008 Annual Report Download - page 119
Download and view the complete annual report
Please find page 119 of the 2008 HTC annual report below. You can navigate through the pages in the report by either clicking on the pages listed below, or by using the keyword search tool below to find specific information within the annual report.-
 1
1 -
2
-
3
-
4
-
5
-
6
-
7
-
8
-
9
-
10
-
11
-
12
-
13
-
14
-
15
-
16
-
17
-
18
-
19
-
20
-
21
-
22
-
23
-
24
-
25
-
26
-
27
-
28
-
29
-
30
-
31
-
32
-
33
-
34
-
35
-
36
-
37
-
38
-
39
-
40
-
41
-
42
-
43
-
44
-
45
-
46
-
47
-
48
-
49
-
50
-
51
-
52
-
53
-
54
-
55
-
56
-
57
-
58
-
59
-
60
-
61
-
62
-
63
-
64
-
65
-
66
-
67
-
68
-
69
-
70
-
71
-
72
-
73
-
74
-
75
-
76
-
77
-
78
-
79
-
80
-
81
-
82
-
83
-
84
-
85
-
86
-
87
-
88
-
89
-
90
-
91
-
92
-
93
-
94
-
95
-
96
-
97
-
98
-
99
-
100
-
101
-
102
-
103
-
104
-
105
-
106
-
107
-
108
-
 109
109 -
 110
110 -
 111
111 -
 112
112 -
 113
113 -
 114
114 -
 115
115 -
 116
116 -
 117
117 -
 118
118 -
 119
119 -
 120
120 -
 121
121 -
 122
122 -
 123
123 -
 124
124
 |
 |

Financial Information
| 103
102 |
2008 Annual Report
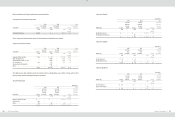
>Other Payables to Related Parties
December 31
2006
2007
2008
Related Party
Amount
% to Total
Other
Payables
Amount
% to Total
Other
Payables
Amount
% to Total
Other
Payables
NT$
NT$
NT$
US$
(Note 3)
Xander International Corp.
$
24
-
$
94
-
$
-
$
-
-
>Service Warranty Expense
2006
2007
2008
Related Party
Amount
% to Total
Warranty
Expenses
Amount
% to Total
Warranty
Expenses
Amount
% to Total
Warranty
Expenses
NT$
NT$
NT$
US$
(Note 3)
Comserve Network Netherlands B.V.
$
11,470
1
$
221,884
6
$
14,491
$
442
-
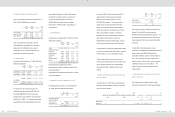
Service warranty expense resulted from authorizing the above related party to provide after-sales services.
Service Fees
2006
2007
2008
Related Party
Amount
% to Total
Service
Expenses
Amount
% to Total
Service
Expenses
Amount
% to Total
Service
Expenses
NT$
NT$
NT$
US$
(Note 3)
Way-Lien Technology Inc.
$
-
-
$
-
-
$
2,400
$
73
-
Captec Partners Management Corp.
-
-
-
-
2,250
69
-
VIA Technologies Inc.
2,400
1
2,400
-
-
-
-
$
2,400
1
$
2,400
-
$
4,650
$
142
-
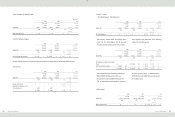
>Leasing - Lessee
-Operating Expense - Rental Expense
2006
2007
2008
Related Party
Amount
% to Total
Rental
Expense
Amount
% to Total
Rental
Expense
Amount
% to Total
Rental
Expense
NT$
NT$
NT$
US$
(Note 3)
VIA Technologies Inc.
$
-
-
$
-
-
$
3,661
$
112
2
The Company leased offices and parking space
owned by VIA Technologies, Inc. at one-year
renewable operating lease agreements, and the
rental payment was determined at the prevailing
rates in the surrounding area.
2006
2007
2008
Related Party
Amount
% to Total
Donation
Expenses
Amount
% to Total
Donation
Expenses
Amount
% to Total
Donation
Expenses
NT$
NT$
NT$
US$
(Note 3)
HTC Education Foundation for Social Welfare
Charity
$
-
-
$
300,000
100
$
300,000
$
9,146
92
High Tech Computer Foundation.
300,000
100
-
-
20,000
610
6
$
300,000
100
$
300,000
100
$
320,000
$
9,756
98
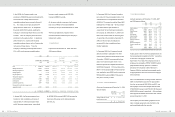
The Company donated NT$300,000 thousand in
2006, NT$300,000 thousand in 2007 and
NT$325,000 thousand (US$9,909 thousand) in
2008 to help disadvantaged minorities, teenagers
and other people in need. Of these donations,
NT$5,000 thousand (US$152 thousand) went to
an unrelated party.
>Other Losses
2006
2007
2008
Related Party
Amount
% to Total
Other Losses
Amount
% to Total
Other Losses
Amount
% to Total
Other Losses
NT$
NT$
NT$
US$
(Note 3)
Xander International Corp.
$
-
-
$
-
-
$
37,500
$
1,143
10