HP 2012 Annual Report Download - page 89
Download and view the complete annual report
Please find page 89 of the 2012 HP annual report below. You can navigate through the pages in the report by either clicking on the pages listed below, or by using the keyword search tool below to find specific information within the annual report.-
 1
1 -
2
-
3
-
4
-
5
-
6
-
7
-
8
-
9
-
10
-
11
-
12
-
13
-
14
-
15
-
16
-
17
-
18
-
19
-
20
-
21
-
22
-
23
-
24
-
25
-
26
-
27
-
28
-
29
-
30
-
31
-
32
-
33
-
34
-
35
-
36
-
37
-
38
-
39
-
40
-
41
-
42
-
43
-
44
-
45
-
46
-
47
-
48
-
49
-
50
-
51
-
52
-
53
-
54
-
55
-
56
-
57
-
58
-
59
-
60
-
61
-
62
-
63
-
64
-
65
-
66
-
67
-
68
-
69
-
70
-
71
-
72
-
73
-
74
-
75
-
76
-
77
-
78
-
 79
79 -
 80
80 -
 81
81 -
 82
82 -
 83
83 -
 84
84 -
 85
85 -
 86
86 -
 87
87 -
 88
88 -
 89
89 -
 90
90 -
 91
91 -
 92
92 -
 93
93 -
 94
94 -
 95
95 -
 96
96 -
 97
97 -
 98
98 -
 99
99 -
100
-
101
-
102
-
103
-
104
-
105
-
106
-
107
-
108
-
109
-
110
-
111
-
112
-
113
-
114
-
115
-
116
-
117
-
118
-
119
-
120
-
121
-
122
-
123
-
124
-
125
-
126
-
127
-
128
-
129
-
130
-
131
-
132
-
133
-
134
-
135
-
136
-
137
-
138
-
139
-
140
-
141
-
142
-
143
-
144
-
145
-
146
-
147
-
148
-
149
-
150
-
151
-
152
-
153
-
154
-
155
-
156
-
157
-
158
-
159
-
160
-
161
-
162
-
163
-
164
-
165
-
166
-
167
-
168
-
169
-
170
-
171
-
172
-
173
-
174
-
175
-
176
-
177
-
178
-
179
-
180
-
181
-
182
-
183
-
184
-
185
-
186
-
187
-
188
-
189
-
190
-
191
-
192
 |
 |

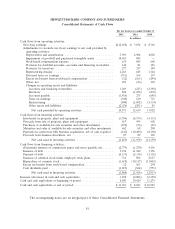
HEWLETT-PACKARD COMPANY AND SUBSIDIARIES
Consolidated Statements of Cash Flows
For the fiscal years ended October 31
2012 2011 2010
In millions
Cash flows from operating activities:
Net (loss) earnings ...................................... $(12,650) $ 7,074 $ 8,761
Adjustments to reconcile net (loss) earnings to net cash provided by
operating activities:
Depreciation and amortization ............................ 5,095 4,984 4,820
Impairment of goodwill and purchased intangible assets .......... 18,035 885 —
Stock-based compensation expense ......................... 635 685 668
Provision for doubtful accounts—accounts and financing receivables . . 142 81 156
Provision for inventory .................................. 277 217 189
Restructuring charges .................................. 2,266 645 1,144
Deferred taxes on earnings ............................... (711) 166 197
Excess tax benefit from stock-based compensation .............. (12) (163) (294)
Other, net .......................................... 265 (46) 169
Changes in operating assets and liabilities:
Accounts and financing receivables ....................... 1,269 (227) (2,398)
Inventory ......................................... 890 (1,252) (270)
Accounts payable .................................... (1,414) 275 (698)
Taxes on earnings .................................... (320) 610 723
Restructuring ....................................... (840) (1,002) (1,334)
Other assets and liabilities .............................. (2,356) (293) 89
Net cash provided by operating activities .................. 10,571 12,639 11,922
Cash flows from investing activities:
Investment in property, plant and equipment .................... (3,706) (4,539) (4,133)
Proceeds from sale of property, plant and equipment .............. 617 999 602
Purchases of available-for-sale securities and other investments ....... (972) (96) (51)
Maturities and sales of available-for-sale securities and other investments . 662 68 200
Payments in connection with business acquisitions, net of cash acquired . (141) (10,480) (8,102)
Proceeds from business divestiture, net ........................ 87 89 125
Net cash used in investing activities ..................... (3,453) (13,959) (11,359)
Cash flows from financing activities:
(Payments) issuance of commercial paper and notes payable, net ...... (2,775) (1,270) 4,156
Issuance of debt ........................................ 5,154 11,942 3,156
Payment of debt ........................................ (4,333) (2,336) (1,323)
Issuance of common stock under employee stock plans ............. 716 896 2,617
Repurchase of common stock .............................. (1,619) (10,117) (11,042)
Excess tax benefit from stock-based compensation ................ 12 163 294
Cash dividends paid ..................................... (1,015) (844) (771)
Net cash used in financing activities ..................... (3,860) (1,566) (2,913)
Increase (decrease) in cash and cash equivalents ................... 3,258 (2,886) (2,350)
Cash and cash equivalents at beginning of period .................. 8,043 10,929 13,279
Cash and cash equivalents at end of period ...................... $11,301 $ 8,043 $ 10,929
The accompanying notes are an integral part of these Consolidated Financial Statements.
81