HP 2012 Annual Report Download - page 86
Download and view the complete annual report
Please find page 86 of the 2012 HP annual report below. You can navigate through the pages in the report by either clicking on the pages listed below, or by using the keyword search tool below to find specific information within the annual report.-
 1
1 -
2
-
3
-
4
-
5
-
6
-
7
-
8
-
9
-
10
-
11
-
12
-
13
-
14
-
15
-
16
-
17
-
18
-
19
-
20
-
21
-
22
-
23
-
24
-
25
-
26
-
27
-
28
-
29
-
30
-
31
-
32
-
33
-
34
-
35
-
36
-
37
-
38
-
39
-
40
-
41
-
42
-
43
-
44
-
45
-
46
-
47
-
48
-
49
-
50
-
51
-
52
-
53
-
54
-
55
-
56
-
57
-
58
-
59
-
60
-
61
-
62
-
63
-
64
-
65
-
66
-
67
-
68
-
69
-
70
-
71
-
72
-
73
-
74
-
75
-
 76
76 -
 77
77 -
 78
78 -
 79
79 -
 80
80 -
 81
81 -
 82
82 -
 83
83 -
 84
84 -
 85
85 -
 86
86 -
 87
87 -
 88
88 -
 89
89 -
 90
90 -
 91
91 -
 92
92 -
 93
93 -
 94
94 -
 95
95 -
 96
96 -
97
-
98
-
99
-
100
-
101
-
102
-
103
-
104
-
105
-
106
-
107
-
108
-
109
-
110
-
111
-
112
-
113
-
114
-
115
-
116
-
117
-
118
-
119
-
120
-
121
-
122
-
123
-
124
-
125
-
126
-
127
-
128
-
129
-
130
-
131
-
132
-
133
-
134
-
135
-
136
-
137
-
138
-
139
-
140
-
141
-
142
-
143
-
144
-
145
-
146
-
147
-
148
-
149
-
150
-
151
-
152
-
153
-
154
-
155
-
156
-
157
-
158
-
159
-
160
-
161
-
162
-
163
-
164
-
165
-
166
-
167
-
168
-
169
-
170
-
171
-
172
-
173
-
174
-
175
-
176
-
177
-
178
-
179
-
180
-
181
-
182
-
183
-
184
-
185
-
186
-
187
-
188
-
189
-
190
-
191
-
192
 |
 |

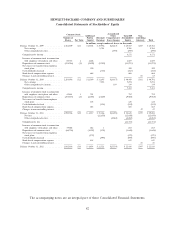
HEWLETT-PACKARD COMPANY AND SUBSIDIARIES
Consolidated Statements of Earnings
For the fiscal years ended October 31
2012 2011 2010
In millions, except per share amounts
Net revenue:
Products ........................................... $ 77,887 $ 84,757 $ 84,799
Services ............................................ 42,008 42,039 40,816
Financing income ..................................... 462 449 418
Total net revenue ................................... 120,357 127,245 126,033
Costs and expenses:
Cost of products ..................................... 59,468 65,167 65,064
Cost of services ...................................... 32,600 31,945 30,486
Financing interest .................................... 317 306 302
Research and development .............................. 3,399 3,254 2,959
Selling, general and administrative ........................ 13,500 13,577 12,822
Amortization of purchased intangible assets .................. 1,784 1,607 1,484
Impairment of goodwill and purchased intangible assets ......... 18,035 885 —
Restructuring charges .................................. 2,266 645 1,144
Acquisition-related charges .............................. 45 182 293
Total operating expenses .............................. 131,414 117,568 114,554
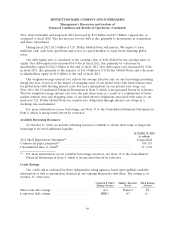
(Loss) earnings from operations ............................ (11,057) 9,677 11,479
Interest and other, net ................................... (876) (695) (505)
(Loss) earnings before taxes ............................... (11,933) 8,982 10,974
Provision for taxes ...................................... (717) (1,908) (2,213)
Net (loss) earnings ..................................... $(12,650) $ 7,074 $ 8,761
Net (loss) earnings per share:
Basic .............................................. $ (6.41) $ 3.38 $ 3.78
Diluted ............................................ $ (6.41) $ 3.32 $ 3.69
Weighted-average shares used to compute net (loss) earnings per
share:
Basic .............................................. 1,974 2,094 2,319
Diluted ............................................ 1,974 2,128 2,372
The accompanying notes are an integral part of these Consolidated Financial Statements.
78