HP 2012 Annual Report Download - page 55
Download and view the complete annual report
Please find page 55 of the 2012 HP annual report below. You can navigate through the pages in the report by either clicking on the pages listed below, or by using the keyword search tool below to find specific information within the annual report.-
 1
1 -
2
-
3
-
4
-
5
-
6
-
7
-
8
-
9
-
10
-
11
-
12
-
13
-
14
-
15
-
16
-
17
-
18
-
19
-
20
-
21
-
22
-
23
-
24
-
25
-
26
-
27
-
28
-
29
-
30
-
31
-
32
-
33
-
34
-
35
-
36
-
37
-
38
-
39
-
40
-
41
-
42
-
43
-
44
-
 45
45 -
 46
46 -
 47
47 -
 48
48 -
 49
49 -
 50
50 -
 51
51 -
 52
52 -
 53
53 -
 54
54 -
 55
55 -
 56
56 -
 57
57 -
 58
58 -
 59
59 -
 60
60 -
 61
61 -
 62
62 -
 63
63 -
 64
64 -
 65
65 -
66
-
67
-
68
-
69
-
70
-
71
-
72
-
73
-
74
-
75
-
76
-
77
-
78
-
79
-
80
-
81
-
82
-
83
-
84
-
85
-
86
-
87
-
88
-
89
-
90
-
91
-
92
-
93
-
94
-
95
-
96
-
97
-
98
-
99
-
100
-
101
-
102
-
103
-
104
-
105
-
106
-
107
-
108
-
109
-
110
-
111
-
112
-
113
-
114
-
115
-
116
-
117
-
118
-
119
-
120
-
121
-
122
-
123
-
124
-
125
-
126
-
127
-
128
-
129
-
130
-
131
-
132
-
133
-
134
-
135
-
136
-
137
-
138
-
139
-
140
-
141
-
142
-
143
-
144
-
145
-
146
-
147
-
148
-
149
-
150
-
151
-
152
-
153
-
154
-
155
-
156
-
157
-
158
-
159
-
160
-
161
-
162
-
163
-
164
-
165
-
166
-
167
-
168
-
169
-
170
-
171
-
172
-
173
-
174
-
175
-
176
-
177
-
178
-
179
-
180
-
181
-
182
-
183
-
184
-
185
-
186
-
187
-
188
-
189
-
190
-
191
-
192
 |
 |
HEWLETT-PACKARD COMPANY AND SUBSIDIARIES
Management’s Discussion and Analysis of
Financial Condition and Results of Operations (Continued)
service and performance vesting conditions on a straight-line basis over the requisite service period of
the award. These compensation costs are determined at the aggregate grant level for service-based
awards and at the individual vesting tranche level for awards with performance and/or market
conditions.
Determining the appropriate fair value model and calculating the fair value of share-based
payment awards requires subjective assumptions, including the expected life of the share-based payment
awards and stock price volatility. We utilize the Black-Scholes option pricing model to value the
service-based stock options granted under our principal option plans. To implement this model, we
examined our historical pattern of option exercises to determine if there were any discernable activity
patterns based on certain employee populations. From this analysis, we identified three employee
populations to which to apply the Black-Scholes model. We determined that implied volatility
calculated based on actively traded options on HP common stock is a better indicator of expected
volatility and future stock price trends than historical volatility.
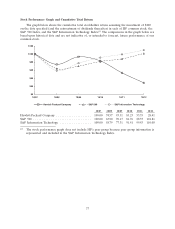
We issued performance-based restricted units (‘‘PRUs’’) representing hypothetical shares of HP
common stock. Each PRU award reflected a target number of shares that may be issued to the award
recipient. We determine the actual number of shares the recipient receives at the end of a three-year
performance period based on results achieved versus goals. The performance goals for PRUs granted in
fiscal year 2012 are based on our annual cash flow from operations as a percentage of revenue and on
our annual revenue growth. The performance goals for PRUs granted prior to fiscal year 2012 are
based on our annual cash flow from operations as a percentage of revenue and on a market condition
based on total shareholder return (‘‘TSR’’) relative to the S&P 500 over the performance period. We
use our closing stock price on the measurement date to estimate the fair value of the PRU awards
granted in fiscal year 2012. We use historic volatility for PRU awards granted prior to fiscal year 2012,
as implied volatility cannot be used when simulating multivariate prices for companies in the S&P 500.
We estimate the fair value of PRUs granted prior to fiscal year 2012 using the Monte Carlo simulation
model, as the TSR modifier contains a market condition. We update the estimated expense, net of
forfeitures, for the cash flow and revenue growth performance against the goal for that year at the end
of each reporting period.
The assumptions used in calculating the fair value of share-based payment awards represent
management’s best estimates, but these estimates involve inherent uncertainties and the application of
management judgment. As a result, if factors change and we use different assumptions, our stock-based
compensation expense could be materially different in the future. In addition, we are required to
estimate the expected forfeiture rate and recognize expense only for those shares expected to meet the
service and performance vesting conditions. If our actual forfeiture rate is materially different from our
estimate, the stock-based compensation expense could be significantly different from what we have
recorded in the current period. See Note 2 to the Consolidated Financial Statements in Item 8 for a
further discussion on stock-based compensation.
Taxes on Earnings
We calculate our current and deferred tax provisions based on estimates and assumptions that
could differ from the final positions reflected in our income tax returns filed during the subsequent
year. We record adjustments based on filed returns when we have identified and finalized them, which
is generally in the third and fourth quarters of the subsequent year for U.S. federal and state
provisions, respectively.
47