HP 2012 Annual Report Download - page 49
Download and view the complete annual report
Please find page 49 of the 2012 HP annual report below. You can navigate through the pages in the report by either clicking on the pages listed below, or by using the keyword search tool below to find specific information within the annual report.-
 1
1 -
2
-
3
-
4
-
5
-
6
-
7
-
8
-
9
-
10
-
11
-
12
-
13
-
14
-
15
-
16
-
17
-
18
-
19
-
20
-
21
-
22
-
23
-
24
-
25
-
26
-
27
-
28
-
29
-
30
-
31
-
32
-
33
-
34
-
35
-
36
-
37
-
38
-
 39
39 -
 40
40 -
 41
41 -
 42
42 -
 43
43 -
 44
44 -
 45
45 -
 46
46 -
 47
47 -
 48
48 -
 49
49 -
 50
50 -
 51
51 -
 52
52 -
 53
53 -
 54
54 -
 55
55 -
 56
56 -
 57
57 -
 58
58 -
 59
59 -
60
-
61
-
62
-
63
-
64
-
65
-
66
-
67
-
68
-
69
-
70
-
71
-
72
-
73
-
74
-
75
-
76
-
77
-
78
-
79
-
80
-
81
-
82
-
83
-
84
-
85
-
86
-
87
-
88
-
89
-
90
-
91
-
92
-
93
-
94
-
95
-
96
-
97
-
98
-
99
-
100
-
101
-
102
-
103
-
104
-
105
-
106
-
107
-
108
-
109
-
110
-
111
-
112
-
113
-
114
-
115
-
116
-
117
-
118
-
119
-
120
-
121
-
122
-
123
-
124
-
125
-
126
-
127
-
128
-
129
-
130
-
131
-
132
-
133
-
134
-
135
-
136
-
137
-
138
-
139
-
140
-
141
-
142
-
143
-
144
-
145
-
146
-
147
-
148
-
149
-
150
-
151
-
152
-
153
-
154
-
155
-
156
-
157
-
158
-
159
-
160
-
161
-
162
-
163
-
164
-
165
-
166
-
167
-
168
-
169
-
170
-
171
-
172
-
173
-
174
-
175
-
176
-
177
-
178
-
179
-
180
-
181
-
182
-
183
-
184
-
185
-
186
-
187
-
188
-
189
-
190
-
191
-
192
 |
 |

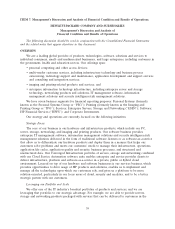
HEWLETT-PACKARD COMPANY AND SUBSIDIARIES
Management’s Discussion and Analysis of
Financial Condition and Results of Operations (Continued)
portfolio of hardware, software and services to solve customer problems. However, the rate at which we
are able to invest in our business and the returns that we are able to achieve from these investments
will be affected by many factors, including the efforts to address the execution, industry and
macroeconomic challenges facing our business as discussed above. As a result, we may experience
delays in the anticipated timing of activities related to these efforts, and the anticipated benefits of
these efforts may not materialize.
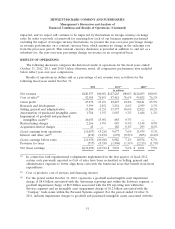
The following provides an overview of our key fiscal 2012 financial metrics:
HP(1) Personal
Consolidated Systems Printing Services ESSN Software HPFS
In millions, except per share amounts
Net revenue .............. $120,357 $35,650 $24,487 $34,922 $20,491 $4,060 $3,819
Year-over-year net revenue %
(decrease) increase ........ (5.4)% (9.9)% (6.5)% (2.2)% (7.1)% 20.6% 6.2%
(Loss) earnings from operations . $(11,057) $ 1,706 $ 3,585 $ 4,095 $ 2,132 $ 827 $ 388
(Loss) earnings from operations
as a % of net revenue ...... (9.2)% 4.8% 14.6% 11.7% 10.4% 20.4% 10.2%
Net loss ................. $(12,650)
Net loss per share
Basic ................. $ (6.41)
Diluted ................ $ (6.41)
(1) HP consolidated net revenue includes a reduction of approximately $3.2 billion primarily related to the
elimination of intersegment net revenue and revenue from our Corporate Investments segment. HP
consolidated (loss) earnings from operations includes amounts related to the impairment of goodwill and
purchased intangible assets, restructuring charges, amortization of purchased intangible assets, corporate and
unallocated costs and eliminations, unallocated costs related to certain stock-based compensation expenses,
acquisition-related charges, and a loss from the Corporate Investments segment.
Cash and cash equivalents at October 31, 2012 totaled $11.3 billion, an increase of $3.3 billion
from the October 31, 2011 balance of $8.0 billion. The increase for fiscal 2012 was due primarily to
$10.6 billion of cash provided from operations, the effect of which was partially offset by $3.1 billion
net investment in property, plant and equipment, $2.6 billion of cash used to repurchase common stock
and pay dividends and $2.0 billion from the net repayment of debt.
We intend the discussion of our financial condition and results of operations that follows to
provide information that will assist in understanding our Consolidated Financial Statements, the
changes in certain key items in those financial statements from year to year, and the primary factors
that accounted for those changes, as well as how certain accounting principles, policies and estimates
affect our Consolidated Financial Statements.
The discussion of results of operations at the consolidated level is followed by a more detailed
discussion of results of operations by segment.
For a further discussion of trends, uncertainties and other factors that could impact our operating
results, see the section entitled ‘‘Risk Factors’’ in Item 1A, which is incorporated herein by reference.
41