HP 2012 Annual Report Download - page 70
Download and view the complete annual report
Please find page 70 of the 2012 HP annual report below. You can navigate through the pages in the report by either clicking on the pages listed below, or by using the keyword search tool below to find specific information within the annual report.-
 1
1 -
2
-
3
-
4
-
5
-
6
-
7
-
8
-
9
-
10
-
11
-
12
-
13
-
14
-
15
-
16
-
17
-
18
-
19
-
20
-
21
-
22
-
23
-
24
-
25
-
26
-
27
-
28
-
29
-
30
-
31
-
32
-
33
-
34
-
35
-
36
-
37
-
38
-
39
-
40
-
41
-
42
-
43
-
44
-
45
-
46
-
47
-
48
-
49
-
50
-
51
-
52
-
53
-
54
-
55
-
56
-
57
-
58
-
59
-
 60
60 -
 61
61 -
 62
62 -
 63
63 -
 64
64 -
 65
65 -
 66
66 -
 67
67 -
 68
68 -
 69
69 -
 70
70 -
 71
71 -
 72
72 -
 73
73 -
 74
74 -
 75
75 -
 76
76 -
 77
77 -
 78
78 -
 79
79 -
 80
80 -
81
-
82
-
83
-
84
-
85
-
86
-
87
-
88
-
89
-
90
-
91
-
92
-
93
-
94
-
95
-
96
-
97
-
98
-
99
-
100
-
101
-
102
-
103
-
104
-
105
-
106
-
107
-
108
-
109
-
110
-
111
-
112
-
113
-
114
-
115
-
116
-
117
-
118
-
119
-
120
-
121
-
122
-
123
-
124
-
125
-
126
-
127
-
128
-
129
-
130
-
131
-
132
-
133
-
134
-
135
-
136
-
137
-
138
-
139
-
140
-
141
-
142
-
143
-
144
-
145
-
146
-
147
-
148
-
149
-
150
-
151
-
152
-
153
-
154
-
155
-
156
-
157
-
158
-
159
-
160
-
161
-
162
-
163
-
164
-
165
-
166
-
167
-
168
-
169
-
170
-
171
-
172
-
173
-
174
-
175
-
176
-
177
-
178
-
179
-
180
-
181
-
182
-
183
-
184
-
185
-
186
-
187
-
188
-
189
-
190
-
191
-
192
 |
 |

HEWLETT-PACKARD COMPANY AND SUBSIDIARIES
Management’s Discussion and Analysis of
Financial Condition and Results of Operations (Continued)
ESSN net revenue increased 9.0% (7.0% when adjusted for currency) in fiscal 2011 due to growth
in Networking and ISS. Total revenue from server and storage blades increased by 11% in fiscal 2011.
ISS net revenue increased by 8% in fiscal 2011, driven primarily by unit volume growth coupled with
increased average unit prices due to favorable demand for the latest generation of ISS products. The
revenue increase was also driven by expansion in our converged infrastructure solutions and strong
demand from public and private cloud customers. Networking net revenue increased by 50% due
largely to our acquisition of 3Com in April 2010, strong market demand for our core data center
products and the impact of our continued investments in sales coverage. Storage net revenue increased
by 7% in fiscal 2011 driven primarily by strong performance in products related to our acquisition of
3PAR in September 2010 and growth in scale out storage arrays, entry-level arrays and StoreOnce data
deduplication products. BCS net revenue decreased by 9% in fiscal 2011 mainly as a result of orders
being delayed or cancelled following an announcement by an alliance partner that it intends to cease
software development for our Itanium-based servers. The impact from reduced sales of Itanium-based
servers was partially offset by higher demand for the latest generation of BCS scale-up x86 products
and growth in NonStop servers.
ESSN earnings from operations as a percentage of net revenue decreased by 0.3 percentage points
in fiscal 2011 driven by an increase in operating expenses as a percentage of net revenue, the effect of
which was partially offset by an increase in gross margin. The increase in operating expenses as a
percentage of net revenue was due primarily to additional expenses associated with acquisitions and
investments in R&D and sales coverage. The gross margin increase was driven by lower product costs
and a higher mix of networking products, the effect of which was partially offset by price declines as a
result of competitive pressure.
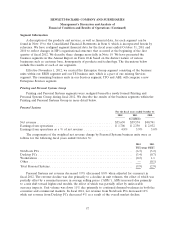
Software
For the fiscal years ended October 31
2012 2011 2010
In millions
Net revenue .......................................... $4,060 $3,367 $2,812
Earnings from operations ................................. $ 827 $ 722 $ 787
Earnings from operations as a % of net revenue ................ 20.4% 21.4% 28.0%
Software net revenue increased 20.6% (21.3% when adjusted for currency) in fiscal 2012 due to
revenues from acquired companies, primarily Autonomy, which was acquired in October, 2011. In fiscal
2012, net revenue from services, support and licenses increased by 71%, 16% and 8%, respectively.
Software earnings from operations as a percentage of net revenue decreased by 1.0 percentage
points in fiscal 2012 due primarily to a decrease in gross margin and a slight increase in operating
expenses as a percentage of net revenue. The gross margin decline was due primarily to a lower mix of
license revenue, the effect of which was partially offset by a highly profitable software deal entered into
in the fourth quarter of fiscal 2012.
Software net revenue increased 19.7% (18.1% when adjusted for currency) in fiscal 2011 due to
revenues from acquired companies as well as growth in the organic business. The revenue growth was
driven by good performance from our security and management suite offerings. In fiscal 2011, net
revenue from services, licenses and support increased by 26%, 23% and 16%, respectively.
62