HP 2012 Annual Report Download - page 76
Download and view the complete annual report
Please find page 76 of the 2012 HP annual report below. You can navigate through the pages in the report by either clicking on the pages listed below, or by using the keyword search tool below to find specific information within the annual report.-
 1
1 -
2
-
3
-
4
-
5
-
6
-
7
-
8
-
9
-
10
-
11
-
12
-
13
-
14
-
15
-
16
-
17
-
18
-
19
-
20
-
21
-
22
-
23
-
24
-
25
-
26
-
27
-
28
-
29
-
30
-
31
-
32
-
33
-
34
-
35
-
36
-
37
-
38
-
39
-
40
-
41
-
42
-
43
-
44
-
45
-
46
-
47
-
48
-
49
-
50
-
51
-
52
-
53
-
54
-
55
-
56
-
57
-
58
-
59
-
60
-
61
-
62
-
63
-
64
-
65
-
 66
66 -
 67
67 -
 68
68 -
 69
69 -
 70
70 -
 71
71 -
 72
72 -
 73
73 -
 74
74 -
 75
75 -
 76
76 -
 77
77 -
 78
78 -
 79
79 -
 80
80 -
 81
81 -
 82
82 -
 83
83 -
 84
84 -
 85
85 -
 86
86 -
87
-
88
-
89
-
90
-
91
-
92
-
93
-
94
-
95
-
96
-
97
-
98
-
99
-
100
-
101
-
102
-
103
-
104
-
105
-
106
-
107
-
108
-
109
-
110
-
111
-
112
-
113
-
114
-
115
-
116
-
117
-
118
-
119
-
120
-
121
-
122
-
123
-
124
-
125
-
126
-
127
-
128
-
129
-
130
-
131
-
132
-
133
-
134
-
135
-
136
-
137
-
138
-
139
-
140
-
141
-
142
-
143
-
144
-
145
-
146
-
147
-
148
-
149
-
150
-
151
-
152
-
153
-
154
-
155
-
156
-
157
-
158
-
159
-
160
-
161
-
162
-
163
-
164
-
165
-
166
-
167
-
168
-
169
-
170
-
171
-
172
-
173
-
174
-
175
-
176
-
177
-
178
-
179
-
180
-
181
-
182
-
183
-
184
-
185
-
186
-
187
-
188
-
189
-
190
-
191
-
192
 |
 |

HEWLETT-PACKARD COMPANY AND SUBSIDIARIES
Management’s Discussion and Analysis of
Financial Condition and Results of Operations (Continued)
The cash conversion cycle for fiscal 2011 increased by five days as compared to fiscal 2010. The
increase in DSO was primarily the result of unfavorable impact on receivables from the Autonomy
acquisition, extended payment terms and an increase in unbilled and aged accounts receivables, the
effect of which was offset by a favorable currency impact due to the strengthening U.S. dollar. The
increase in DOS was a result of higher inventory levels at October 31, 2011 due primarily to a macro
economic slowdown impacting our consumer businesses, the timing of shipments in our commercial
hardware businesses and strategic purchases of certain components. DPO remained flat year over year.
Investing Activities
Net cash used in investing activities decreased by $10.5 billion for fiscal 2012 as compared to fiscal
2011, due primarily to lower investments in acquisitions in 2012. Net cash used in investing activities
increased by approximately $2.6 billion for fiscal 2011 as compared to fiscal 2010, due primarily to
higher investments in acquisitions in 2011.
Financing Activities
Net cash used in financing activities increased by approximately $2.3 billion for fiscal 2012 as
compared to fiscal 2011. The increase was due primarily to lower net proceeds from the issuance of
U.S. Dollar Global Notes and an increase in net repayment of commercial paper, the impact of which
was partially offset by lower cash paid for repurchases of our common stock. Net cash used in financing
activities decreased by approximately $1.3 billion for fiscal 2011 as compared to fiscal 2010. The
decrease was due primarily to higher net proceeds from the issuance of debt and a decrease in cash
paid for repurchases of our common stock, the impact of which was partially offset by higher net
repayment of commercial paper and a decrease in cash received from the issuance of common stock
under employee stock plans.
For more information on our share repurchase programs, see Item 5 and Note 15 to the
Consolidated Financial Statements in Item 8, which are incorporated herein by reference.
CAPITAL RESOURCES
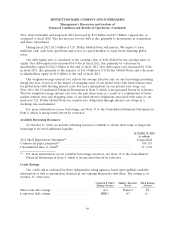
Debt Levels
For the fiscal years ended October 31
2012 2011 2010
In millions, except
interest rates and ratios
Short-term debt ....................................... $ 6,647 $ 8,083 $ 7,046
Long-term debt ....................................... $21,789 $22,551 $15,258
Debt-equity ratio ...................................... 1.25x 0.79x 0.55x
Weighted-average interest rate ............................ 2.95% 2.4% 2.0%
We maintain debt levels that we establish through consideration of a number of factors, including
cash flow expectations, cash requirements for operations, cash needed to support our financing
business, investment plans (including acquisitions), share repurchase activities, overall cost of capital,
and targeted capital structure.
Short-term debt and long-term debt decreased by $1.4 billion and $0.8 billion, respectively, for
fiscal 2012 as compared to fiscal 2011. The net decrease in total debt is due primarily to fewer
acquisitions, and lower levels of share repurchases coupled with maturities in some obligations. In fiscal
68