HP 2012 Annual Report Download - page 73
Download and view the complete annual report
Please find page 73 of the 2012 HP annual report below. You can navigate through the pages in the report by either clicking on the pages listed below, or by using the keyword search tool below to find specific information within the annual report.-
 1
1 -
2
-
3
-
4
-
5
-
6
-
7
-
8
-
9
-
10
-
11
-
12
-
13
-
14
-
15
-
16
-
17
-
18
-
19
-
20
-
21
-
22
-
23
-
24
-
25
-
26
-
27
-
28
-
29
-
30
-
31
-
32
-
33
-
34
-
35
-
36
-
37
-
38
-
39
-
40
-
41
-
42
-
43
-
44
-
45
-
46
-
47
-
48
-
49
-
50
-
51
-
52
-
53
-
54
-
55
-
56
-
57
-
58
-
59
-
60
-
61
-
62
-
 63
63 -
 64
64 -
 65
65 -
 66
66 -
 67
67 -
 68
68 -
 69
69 -
 70
70 -
 71
71 -
 72
72 -
 73
73 -
 74
74 -
 75
75 -
 76
76 -
 77
77 -
 78
78 -
 79
79 -
 80
80 -
 81
81 -
 82
82 -
 83
83 -
84
-
85
-
86
-
87
-
88
-
89
-
90
-
91
-
92
-
93
-
94
-
95
-
96
-
97
-
98
-
99
-
100
-
101
-
102
-
103
-
104
-
105
-
106
-
107
-
108
-
109
-
110
-
111
-
112
-
113
-
114
-
115
-
116
-
117
-
118
-
119
-
120
-
121
-
122
-
123
-
124
-
125
-
126
-
127
-
128
-
129
-
130
-
131
-
132
-
133
-
134
-
135
-
136
-
137
-
138
-
139
-
140
-
141
-
142
-
143
-
144
-
145
-
146
-
147
-
148
-
149
-
150
-
151
-
152
-
153
-
154
-
155
-
156
-
157
-
158
-
159
-
160
-
161
-
162
-
163
-
164
-
165
-
166
-
167
-
168
-
169
-
170
-
171
-
172
-
173
-
174
-
175
-
176
-
177
-
178
-
179
-
180
-
181
-
182
-
183
-
184
-
185
-
186
-
187
-
188
-
189
-
190
-
191
-
192
 |
 |

HEWLETT-PACKARD COMPANY AND SUBSIDIARIES
Management’s Discussion and Analysis of
Financial Condition and Results of Operations (Continued)
HPFS recorded net bad debt expenses of $54 million and $60 million in fiscal 2012 and fiscal 2011,
respectively.
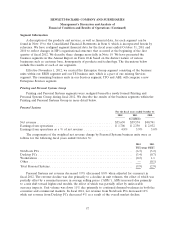
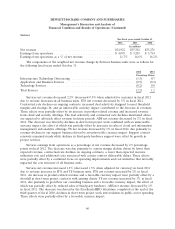
Corporate Investments
For the fiscal years ended October 31
2012 2011 2010
In millions
Net revenue ......................................... $ 108 $ 208 $ 214
Loss from operations ................................... $ (238) $(1,619) $ (358)
Loss from operations as a % of net revenue .................. (220.4)% (778.4)% (167.3)%
Net revenue in Corporate Investments in fiscal 2012 relates primarily to business intelligence
solutions and the former webOS device business. In fiscal 2012, the revenue decrease was a result of
lower sales due to the wind down of the webOS device business announced in August 2011.
Corporate Investments reported a smaller loss from operations in fiscal 2012 due primarily to the
absence in the current period of charges recognized in the prior period related to the wind down of the
webOS device business. The loss from operations in Corporate Investments was also due to expenses
carried in the segment associated with corporate strategy, global alliances and HP Labs.
Net revenue in Corporate Investments in fiscal 2011 relates primarily to mobile devices associated
with the Palm acquisition, business intelligence solutions and licensing of HP technology to third
parties. In fiscal 2011, the revenue decrease was due primarily to lower business intelligence solutions
revenue, the effect of which was partially offset by revenue from webOS devices. Business intelligence
solutions revenue declined mainly due to lower revenue from consulting services.
Corporate Investments reported a higher loss from operations in fiscal 2011 due to $755 million of
expenses primarily for supplier-related obligations and sales incentive programs related to winding
down the webOS device business. The loss from operations in Corporate Investments was also due to
expenses carried in the segment associated with corporate development, global alliances and HP Labs,
which expenses increased from fiscal 2010 and were partially offset by a gain on the divestiture of HP’s
Halo video collaboration products business.
LIQUIDITY AND CAPITAL RESOURCES
Our cash balances are held in numerous locations throughout the world, with substantially all of
those amounts held outside of the United States. Amounts held outside of the United States are
generally utilized to support non-U.S. liquidity needs, although a portion of those amounts may from
time to time be subject to short-term intercompany loans into the United States. Most of the amounts
held outside of the United States could be repatriated to the United States but, under current law,
would be subject to United States federal income taxes, less applicable foreign tax credits. Repatriation
of some foreign balances is restricted by local laws. Except for foreign earnings that are considered
indefinitely reinvested outside of the United States, we have provided for the U.S. federal tax liability
on these earnings for financial statement purposes. Repatriation could result in additional income tax
payments in future years. Where local restrictions prevent an efficient intercompany transfer of funds,
our intent is that cash balances would remain outside of the United States and we would meet liquidity
needs through ongoing cash flows, external borrowings, or both. We utilize a variety of tax planning
and financing strategies in an effort to ensure that our worldwide cash is available in the locations in
which it is needed. We do not expect restrictions or potential taxes on repatriation of amounts held
65