HP 2012 Annual Report Download - page 110
Download and view the complete annual report
Please find page 110 of the 2012 HP annual report below. You can navigate through the pages in the report by either clicking on the pages listed below, or by using the keyword search tool below to find specific information within the annual report.-
 1
1 -
2
-
3
-
4
-
5
-
6
-
7
-
8
-
9
-
10
-
11
-
12
-
13
-
14
-
15
-
16
-
17
-
18
-
19
-
20
-
21
-
22
-
23
-
24
-
25
-
26
-
27
-
28
-
29
-
30
-
31
-
32
-
33
-
34
-
35
-
36
-
37
-
38
-
39
-
40
-
41
-
42
-
43
-
44
-
45
-
46
-
47
-
48
-
49
-
50
-
51
-
52
-
53
-
54
-
55
-
56
-
57
-
58
-
59
-
60
-
61
-
62
-
63
-
64
-
65
-
66
-
67
-
68
-
69
-
70
-
71
-
72
-
73
-
74
-
75
-
76
-
77
-
78
-
79
-
80
-
81
-
82
-
83
-
84
-
85
-
86
-
87
-
88
-
89
-
90
-
91
-
92
-
93
-
94
-
95
-
96
-
97
-
98
-
99
-
 100
100 -
 101
101 -
 102
102 -
 103
103 -
 104
104 -
 105
105 -
 106
106 -
 107
107 -
 108
108 -
 109
109 -
 110
110 -
 111
111 -
 112
112 -
 113
113 -
 114
114 -
 115
115 -
 116
116 -
 117
117 -
 118
118 -
 119
119 -
 120
120 -
121
-
122
-
123
-
124
-
125
-
126
-
127
-
128
-
129
-
130
-
131
-
132
-
133
-
134
-
135
-
136
-
137
-
138
-
139
-
140
-
141
-
142
-
143
-
144
-
145
-
146
-
147
-
148
-
149
-
150
-
151
-
152
-
153
-
154
-
155
-
156
-
157
-
158
-
159
-
160
-
161
-
162
-
163
-
164
-
165
-
166
-
167
-
168
-
169
-
170
-
171
-
172
-
173
-
174
-
175
-
176
-
177
-
178
-
179
-
180
-
181
-
182
-
183
-
184
-
185
-
186
-
187
-
188
-
189
-
190
-
191
-
192
 |
 |

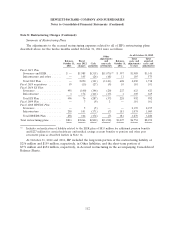
HEWLETT-PACKARD COMPANY AND SUBSIDIARIES
Notes to Consolidated Financial Statements (Continued)
Note 4: Balance Sheet Details (Continued)
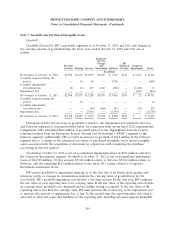
Property, Plant and Equipment
2012 2011
In millions
Land........................................................ $ 636 $ 687
Buildings and leasehold improvements ................................ 8,744 8,620
Machinery and equipment ......................................... 16,503 16,155
25,883 25,462
Accumulated depreciation ......................................... (13,929) (13,170)
$ 11,954 $ 12,292
Depreciation expense was approximately $3.3 billion in fiscal 2012, $3.4 billion in fiscal 2011 and
$3.3 billion in fiscal 2010. For the twelve months ended October 31, 2012, additions to gross property,
plant and equipment of $3.7 billion were partially offset by sales and retirements totaling $2.7 billion.
Accumulated depreciation associated with the assets sold and retired was $2.2 billion.
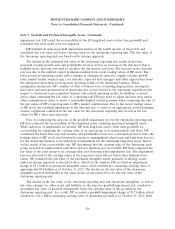
Long-Term Financing Receivables and Other Assets
2012 2011
In millions
Financing receivables, net .......................................... $ 4,292 $ 4,015
Deferred tax assets—long-term ...................................... 1,581 1,283
Deferred costs—long-term .......................................... 1,301 1,496
Other ......................................................... 3,419 3,961
$10,593 $10,755
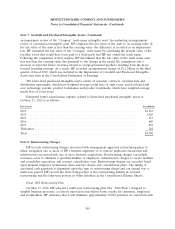
Other Accrued Liabilities
2012 2011
In millions
Other accrued taxes .............................................. $ 3,264 $ 2,414
Warranty ...................................................... 1,496 1,773
Sales and marketing programs ....................................... 2,900 3,317
Other ......................................................... 5,840 6,955
$13,500 $14,459
102