HP 2012 Annual Report Download - page 62
Download and view the complete annual report
Please find page 62 of the 2012 HP annual report below. You can navigate through the pages in the report by either clicking on the pages listed below, or by using the keyword search tool below to find specific information within the annual report.-
 1
1 -
2
-
3
-
4
-
5
-
6
-
7
-
8
-
9
-
10
-
11
-
12
-
13
-
14
-
15
-
16
-
17
-
18
-
19
-
20
-
21
-
22
-
23
-
24
-
25
-
26
-
27
-
28
-
29
-
30
-
31
-
32
-
33
-
34
-
35
-
36
-
37
-
38
-
39
-
40
-
41
-
42
-
43
-
44
-
45
-
46
-
47
-
48
-
49
-
50
-
51
-
 52
52 -
 53
53 -
 54
54 -
 55
55 -
 56
56 -
 57
57 -
 58
58 -
 59
59 -
 60
60 -
 61
61 -
 62
62 -
 63
63 -
 64
64 -
 65
65 -
 66
66 -
 67
67 -
 68
68 -
 69
69 -
 70
70 -
 71
71 -
 72
72 -
73
-
74
-
75
-
76
-
77
-
78
-
79
-
80
-
81
-
82
-
83
-
84
-
85
-
86
-
87
-
88
-
89
-
90
-
91
-
92
-
93
-
94
-
95
-
96
-
97
-
98
-
99
-
100
-
101
-
102
-
103
-
104
-
105
-
106
-
107
-
108
-
109
-
110
-
111
-
112
-
113
-
114
-
115
-
116
-
117
-
118
-
119
-
120
-
121
-
122
-
123
-
124
-
125
-
126
-
127
-
128
-
129
-
130
-
131
-
132
-
133
-
134
-
135
-
136
-
137
-
138
-
139
-
140
-
141
-
142
-
143
-
144
-
145
-
146
-
147
-
148
-
149
-
150
-
151
-
152
-
153
-
154
-
155
-
156
-
157
-
158
-
159
-
160
-
161
-
162
-
163
-
164
-
165
-
166
-
167
-
168
-
169
-
170
-
171
-
172
-
173
-
174
-
175
-
176
-
177
-
178
-
179
-
180
-
181
-
182
-
183
-
184
-
185
-
186
-
187
-
188
-
189
-
190
-
191
-
192
 |
 |
HEWLETT-PACKARD COMPANY AND SUBSIDIARIES
Management’s Discussion and Analysis of
Financial Condition and Results of Operations (Continued)
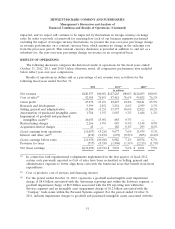
Services gross margin decreased in fiscal 2011 due primarily to lower than expected revenue, rate
concessions arising from recent contract renewals, a lower than expected resource utilization rate and a
higher mix of lower-margin Infrastructure Technology Outsourcing revenue. These effects were partially
offset by a continued focus on operating improvements and cost initiatives that favorably impacted the
cost structure of both our enterprise services and technology services businesses.
ESSN gross margin increased in fiscal 2011 primarily as a result of lower product costs and a
higher mix of networking products, the effect of which was partially offset by price declines as a result
of competitive pressure.
Software gross margin decreased in fiscal 2011 due primarily to rate declines in licenses and
services.
HPFS gross margin decreased in fiscal 2011 due primarily to lower portfolio margins from a higher
mix of operating leases, the effect of which was partially offset by lower bad debt expense as a
percentage of revenue and higher margins on lease extensions and buyouts.
Corporate Investments gross margin decreased in fiscal 2011 primarily as a result of the impact of
the wind down of the webOS device business, which resulted in expenses for supplier-related
obligations, sales incentive programs and inventory write downs.
Operating Expenses
Research and Development
Total research and development (‘‘R&D’’) expense increased in fiscal 2012 due primarily to
additional expense from the acquisition of Autonomy and innovation-focused spending for storage,
networking and HP converged cloud. These effects were partially offset by the elimination of R&D
expense associated with the former webOS device business. In fiscal 2012, R&D expense increased for
ESSN, Software, Personal Systems, Printing and Services and decreased for Corporate Investments.
Total R&D expense increased in fiscal 2011 due primarily to additional expenses from acquired
companies. In fiscal 2011, R&D expense increased for ESSN, Corporate Investments and Software and
decreased for Services and Personal Systems. The increase for ESSN was driven by acquisition
investments and innovation-focused spend in networking and storage products. The increase for
Corporate Investments was due to investments in the development of webOS and webOS devices
during the first three quarters of fiscal 2011.
Selling, General and Administrative
Total selling, general and administrative (‘‘SG&A’’) expense decreased in fiscal 2012 due primarily
to lower marketing costs. Included in SG&A was $103 million in net gains from the sale of real estate.
In fiscal 2012, SG&A expense as a percentage of net revenue was mostly flat for each of our segments
except for Corporate Investments, which experienced a decrease.
Total SG&A expense increased in fiscal 2011 due primarily to higher field selling costs as a result
of our investments in sales resources to grow revenue. The increase in fiscal 2011 was partially offset by
$334 million in net gains on the sale of real estate and a $77 million net gain on the divestiture of our
Halo video collaboration products business. In fiscal 2011, SG&A expense as a percentage of net
revenue increased for each of our segments except for HPFS, Services and Printing, each of which
experienced a decrease.
54