HP 2012 Annual Report Download - page 65
Download and view the complete annual report
Please find page 65 of the 2012 HP annual report below. You can navigate through the pages in the report by either clicking on the pages listed below, or by using the keyword search tool below to find specific information within the annual report.-
 1
1 -
2
-
3
-
4
-
5
-
6
-
7
-
8
-
9
-
10
-
11
-
12
-
13
-
14
-
15
-
16
-
17
-
18
-
19
-
20
-
21
-
22
-
23
-
24
-
25
-
26
-
27
-
28
-
29
-
30
-
31
-
32
-
33
-
34
-
35
-
36
-
37
-
38
-
39
-
40
-
41
-
42
-
43
-
44
-
45
-
46
-
47
-
48
-
49
-
50
-
51
-
52
-
53
-
54
-
 55
55 -
 56
56 -
 57
57 -
 58
58 -
 59
59 -
 60
60 -
 61
61 -
 62
62 -
 63
63 -
 64
64 -
 65
65 -
 66
66 -
 67
67 -
 68
68 -
 69
69 -
 70
70 -
 71
71 -
 72
72 -
 73
73 -
 74
74 -
 75
75 -
76
-
77
-
78
-
79
-
80
-
81
-
82
-
83
-
84
-
85
-
86
-
87
-
88
-
89
-
90
-
91
-
92
-
93
-
94
-
95
-
96
-
97
-
98
-
99
-
100
-
101
-
102
-
103
-
104
-
105
-
106
-
107
-
108
-
109
-
110
-
111
-
112
-
113
-
114
-
115
-
116
-
117
-
118
-
119
-
120
-
121
-
122
-
123
-
124
-
125
-
126
-
127
-
128
-
129
-
130
-
131
-
132
-
133
-
134
-
135
-
136
-
137
-
138
-
139
-
140
-
141
-
142
-
143
-
144
-
145
-
146
-
147
-
148
-
149
-
150
-
151
-
152
-
153
-
154
-
155
-
156
-
157
-
158
-
159
-
160
-
161
-
162
-
163
-
164
-
165
-
166
-
167
-
168
-
169
-
170
-
171
-
172
-
173
-
174
-
175
-
176
-
177
-
178
-
179
-
180
-
181
-
182
-
183
-
184
-
185
-
186
-
187
-
188
-
189
-
190
-
191
-
192
 |
 |

HEWLETT-PACKARD COMPANY AND SUBSIDIARIES
Management’s Discussion and Analysis of
Financial Condition and Results of Operations (Continued)
Segment Information
A description of the products and services, as well as financial data, for each segment can be
found in Note 19 to the Consolidated Financial Statements in Item 8, which is incorporated herein by
reference. We have realigned segment financial data for the fiscal years ended October 31, 2011 and
2010 to reflect changes in HP’s organizational structure that occurred at the beginning of the first
quarter of fiscal 2012. We describe these changes more fully in Note 19. We have presented the
business segments in this Annual Report on Form 10-K based on the distinct nature of various
businesses such as customer base, homogeneity of products and technology. The discussions below
include the results of each of our segments.
Effective November 1, 2012, we created the Enterprise Group segment consisting of the business
units within our ESSN segment and our TS business unit, which is a part of our existing Services
segment. The remaining business units in our Services segment, ITO and ABS, will comprise a new
Enterprise Services segment.
Printing and Personal Systems Group
Printing and Personal Systems segments were realigned beneath a newly formed Printing and
Personal Systems Group during fiscal 2012. We describe the results of the business segments within the
Printing and Personal Systems Group in more detail below.
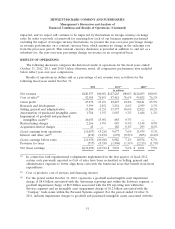
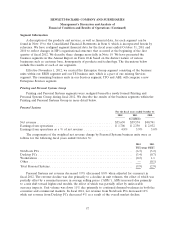
Personal Systems
For the fiscal years ended October 31
2012 2011 2010
In millions
Net revenue ........................................... $35,650 $39,574 $40,741
Earnings from operations ................................. $ 1,706 $ 2,350 $ 2,032
Earnings from operations as a % of net revenue ................ 4.8% 5.9% 5.0%
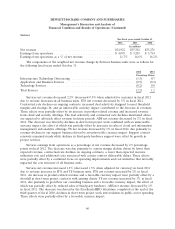
The components of the weighted net revenue change by Personal Systems business units were as
follows for the following fiscal years ended October 31:
2012 2011
Percentage Points
Notebook PCs ..................................................... (6.3) (3.2)
Desktop PCs ...................................................... (3.4) (0.7)
Workstations ...................................................... (0.2) 1.1
Other ........................................................... — (0.1)
Total Personal Systems ............................................... (9.9) (2.9)
Personal Systems net revenue decreased 9.9% (decreased 8.8% when adjusted for currency) in
fiscal 2012. The revenue decline was due primarily to a decline in unit volumes, the effect of which was
partially offset by a nominal increase in average selling prices (‘‘ASPs’’). ASPs increased due primarily
to a mix shift toward higher-end models, the effect of which was partially offset by unfavorable
currency impacts. Unit volume was down 11% due primarily to continued demand weakness in both the
consumer and commercial markets. In fiscal 2012, net revenue from Notebook PCs decreased 12%
while net revenue from Desktop PCs decreased 9% as a result of the overall market decline.
57