HP 2012 Annual Report Download - page 59
Download and view the complete annual report
Please find page 59 of the 2012 HP annual report below. You can navigate through the pages in the report by either clicking on the pages listed below, or by using the keyword search tool below to find specific information within the annual report.-
 1
1 -
2
-
3
-
4
-
5
-
6
-
7
-
8
-
9
-
10
-
11
-
12
-
13
-
14
-
15
-
16
-
17
-
18
-
19
-
20
-
21
-
22
-
23
-
24
-
25
-
26
-
27
-
28
-
29
-
30
-
31
-
32
-
33
-
34
-
35
-
36
-
37
-
38
-
39
-
40
-
41
-
42
-
43
-
44
-
45
-
46
-
47
-
48
-
 49
49 -
 50
50 -
 51
51 -
 52
52 -
 53
53 -
 54
54 -
 55
55 -
 56
56 -
 57
57 -
 58
58 -
 59
59 -
 60
60 -
 61
61 -
 62
62 -
 63
63 -
 64
64 -
 65
65 -
 66
66 -
 67
67 -
 68
68 -
 69
69 -
70
-
71
-
72
-
73
-
74
-
75
-
76
-
77
-
78
-
79
-
80
-
81
-
82
-
83
-
84
-
85
-
86
-
87
-
88
-
89
-
90
-
91
-
92
-
93
-
94
-
95
-
96
-
97
-
98
-
99
-
100
-
101
-
102
-
103
-
104
-
105
-
106
-
107
-
108
-
109
-
110
-
111
-
112
-
113
-
114
-
115
-
116
-
117
-
118
-
119
-
120
-
121
-
122
-
123
-
124
-
125
-
126
-
127
-
128
-
129
-
130
-
131
-
132
-
133
-
134
-
135
-
136
-
137
-
138
-
139
-
140
-
141
-
142
-
143
-
144
-
145
-
146
-
147
-
148
-
149
-
150
-
151
-
152
-
153
-
154
-
155
-
156
-
157
-
158
-
159
-
160
-
161
-
162
-
163
-
164
-
165
-
166
-
167
-
168
-
169
-
170
-
171
-
172
-
173
-
174
-
175
-
176
-
177
-
178
-
179
-
180
-
181
-
182
-
183
-
184
-
185
-
186
-
187
-
188
-
189
-
190
-
191
-
192
 |
 |

HEWLETT-PACKARD COMPANY AND SUBSIDIARIES
Management’s Discussion and Analysis of
Financial Condition and Results of Operations (Continued)
impacted, and we expect will continue to be impacted, by fluctuations in foreign currency exchange
rates. In order to provide a framework for assessing how each of our business segments performed
excluding the impact of foreign currency fluctuations, we present the year-over-year percentage change
in revenue performance on a constant currency basis, which assumes no change in the exchange rate
from the prior-year period. This constant currency disclosure is provided in addition to, and not as a
substitute for, the year-over-year percentage change in revenue on an as-reported basis.
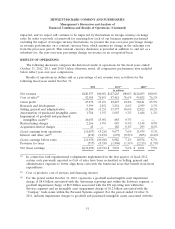
RESULTS OF OPERATIONS
The following discussion compares the historical results of operations for the fiscal years ended
October 31, 2012, 2011, and 2010. Unless otherwise noted, all comparative performance data included
below reflect year-over-year comparisons.
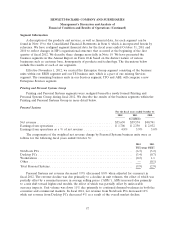
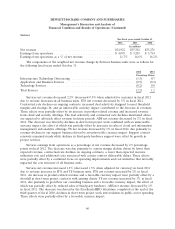
Results of operations in dollars and as a percentage of net revenue were as follows for the
following fiscal years ended October 31:
2012 2011(1) 2010(1)
In millions
Net revenue ......................... $120,357 100.0% $127,245 100.0% $126,033 100.0%
Cost of sales(2) ....................... 92,385 76.8% 97,418 76.6% 95,852 76.1%
Gross profit ......................... 27,972 23.2% 29,827 23.4% 30,181 23.9%
Research and development .............. 3,399 2.8% 3,254 2.6% 2,959 2.3%
Selling, general and administrative ......... 13,500 11.2% 13,577 10.6% 12,822 10.2%
Amortization of purchased intangible assets . . 1,784 1.5% 1,607 1.3% 1,484 1.2%
Impairment of goodwill and purchased
intangibles assets(3) .................. 18,035 15.0% 885 0.7% — —
Restructuring charges .................. 2,266 1.9% 645 0.5% 1,144 0.9%
Acquisition-related charges .............. 45 — 182 0.1% 293 0.2%
(Loss) earnings from operations .......... (11,057) (9.2)% 9,677 7.6% 11,479 9.1%
Interest and other, net(4) ................ (876) (0.8)% (695) (0.5)% (505) (0.4)%
(Loss) earnings before taxes ............. (11,933) (10.0)% 8,982 7.1% 10,974 8.7%
Provision for taxes .................... (717) (0.5)% (1,908) (1.5)% (2,213) (1.7)%
Net (loss) earnings .................... $(12,650) (10.5)% $ 7,074 5.6% $ 8,761 7.0%
(1) In connection with organizational realignments implemented in the first quarter of fiscal 2012,
certain costs previously reported as Cost of sales have been reclassified as Selling, general and
administrative expenses to better align those costs with the functional areas that benefit from those
expenditures.
(2) Cost of products, cost of services and financing interest.
(3) For the period ended October 31, 2012, represents a goodwill and intangible asset impairment
charge of $8.8 billion associated with the Autonomy reporting unit within the Software segment, a
goodwill impairment charge of $8.0 billion associated with the ES reporting unit within the
Services segment and an intangible asset impairment charge of $1.2 billion associated with the
‘‘Compaq’’ trade name within the Personal Systems segment. For the period ended October 31,
2011, includes impairment charges to goodwill and purchased intangible assets associated with the
51