HP 2012 Annual Report Download - page 103
Download and view the complete annual report
Please find page 103 of the 2012 HP annual report below. You can navigate through the pages in the report by either clicking on the pages listed below, or by using the keyword search tool below to find specific information within the annual report.-
 1
1 -
2
-
3
-
4
-
5
-
6
-
7
-
8
-
9
-
10
-
11
-
12
-
13
-
14
-
15
-
16
-
17
-
18
-
19
-
20
-
21
-
22
-
23
-
24
-
25
-
26
-
27
-
28
-
29
-
30
-
31
-
32
-
33
-
34
-
35
-
36
-
37
-
38
-
39
-
40
-
41
-
42
-
43
-
44
-
45
-
46
-
47
-
48
-
49
-
50
-
51
-
52
-
53
-
54
-
55
-
56
-
57
-
58
-
59
-
60
-
61
-
62
-
63
-
64
-
65
-
66
-
67
-
68
-
69
-
70
-
71
-
72
-
73
-
74
-
75
-
76
-
77
-
78
-
79
-
80
-
81
-
82
-
83
-
84
-
85
-
86
-
87
-
88
-
89
-
90
-
91
-
92
-
 93
93 -
 94
94 -
 95
95 -
 96
96 -
 97
97 -
 98
98 -
 99
99 -
 100
100 -
 101
101 -
 102
102 -
 103
103 -
 104
104 -
 105
105 -
 106
106 -
 107
107 -
 108
108 -
 109
109 -
 110
110 -
 111
111 -
 112
112 -
 113
113 -
114
-
115
-
116
-
117
-
118
-
119
-
120
-
121
-
122
-
123
-
124
-
125
-
126
-
127
-
128
-
129
-
130
-
131
-
132
-
133
-
134
-
135
-
136
-
137
-
138
-
139
-
140
-
141
-
142
-
143
-
144
-
145
-
146
-
147
-
148
-
149
-
150
-
151
-
152
-
153
-
154
-
155
-
156
-
157
-
158
-
159
-
160
-
161
-
162
-
163
-
164
-
165
-
166
-
167
-
168
-
169
-
170
-
171
-
172
-
173
-
174
-
175
-
176
-
177
-
178
-
179
-
180
-
181
-
182
-
183
-
184
-
185
-
186
-
187
-
188
-
189
-
190
-
191
-
192
 |
 |

HEWLETT-PACKARD COMPANY AND SUBSIDIARIES
Notes to Consolidated Financial Statements (Continued)
Note 2: Stock-Based Compensation (Continued)
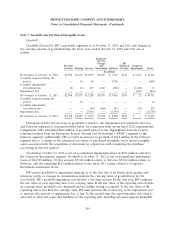
Stock Options
HP utilized the Black-Scholes option pricing model to value the service-based stock options
granted under its principal equity plans. HP examined its historical pattern of option exercises in an
effort to determine if there were any discernable activity patterns based on certain employee
populations. From this analysis, HP identified three employee populations for which to apply the Black-
Scholes model. The table below presents the weighted-average expected life in months of the combined
three identified employee populations. The expected life computation is based on historical exercise
patterns and post-vesting termination behavior within each of the three populations identified. The
risk-free interest rate for periods within the contractual life of the award is based on the U.S. Treasury
yield curve in effect at the time of grant. HP estimates the fair value of the performance-contingent
stock options using a combination of the Monte Carlo simulation model and lattice model, as these
awards contain market conditions.
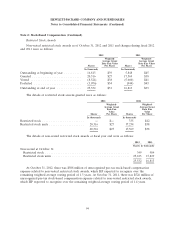
HP estimated the weighted-average fair value of stock options using the following weighted-
average assumptions:
2012 2011 2010
Weighted-average fair value of grants per share(1) ...................... $9.06 $7.85 $13.33
Implied volatility ............................................. 42% 41% 30%
Risk-free interest rate .......................................... 1.17% 1.20% 2.06%
Dividend yield ............................................... 1.83% 1.97% 0.68%
Expected life in months ........................................ 67 63 61
(1) The fair value calculation was based on stock options granted during the period.
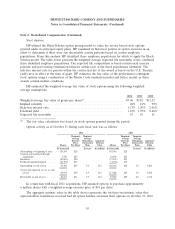
Option activity as of October 31 during each fiscal year was as follows:
2012 2011
Weighted- Weighted- Weighted- Weighted-
Average Average Average Average
Exercise Remaining Aggregate Exercise Remaining Aggregate
Price Contractual Intrinsic Price Contractual Intrinsic
Shares Per Share Term Value Shares Per Share Term Value
In thousands In years In millions In thousands In years In millions
Outstanding at beginning of year . . 120,243 $28 142,916 $28
Granted and assumed through
acquisitions ............. 7,529 $27 18,804 $21
Exercised ................ (29,683) $20 (37,121) $23
Forfeited/cancelled/expired ...... (10,793) $35 (4,356) $39
Outstanding at end of year ..... 87,296 $29 3.0 $15 120,243 $28 3.0 $460
Vested and expected to vest at end
of year ................ 85,935 $29 2.9 $15 117,066 $28 2.9 $442
Exercisable at end of year ...... 68,437 $31 1.9 $12 97,967 $29 2.0 $332
In connection with fiscal 2011 acquisitions, HP assumed options to purchase approximately
6 million shares with a weighted-average exercise price of $14 per share.
The aggregate intrinsic value in the table above represents the total pre-tax intrinsic value that
option holders would have received had all option holders exercised their options on October 31, 2012
95