HP 2012 Annual Report Download - page 139
Download and view the complete annual report
Please find page 139 of the 2012 HP annual report below. You can navigate through the pages in the report by either clicking on the pages listed below, or by using the keyword search tool below to find specific information within the annual report.-
 1
1 -
2
-
3
-
4
-
5
-
6
-
7
-
8
-
9
-
10
-
11
-
12
-
13
-
14
-
15
-
16
-
17
-
18
-
19
-
20
-
21
-
22
-
23
-
24
-
25
-
26
-
27
-
28
-
29
-
30
-
31
-
32
-
33
-
34
-
35
-
36
-
37
-
38
-
39
-
40
-
41
-
42
-
43
-
44
-
45
-
46
-
47
-
48
-
49
-
50
-
51
-
52
-
53
-
54
-
55
-
56
-
57
-
58
-
59
-
60
-
61
-
62
-
63
-
64
-
65
-
66
-
67
-
68
-
69
-
70
-
71
-
72
-
73
-
74
-
75
-
76
-
77
-
78
-
79
-
80
-
81
-
82
-
83
-
84
-
85
-
86
-
87
-
88
-
89
-
90
-
91
-
92
-
93
-
94
-
95
-
96
-
97
-
98
-
99
-
100
-
101
-
102
-
103
-
104
-
105
-
106
-
107
-
108
-
109
-
110
-
111
-
112
-
113
-
114
-
115
-
116
-
117
-
118
-
119
-
120
-
121
-
122
-
123
-
124
-
125
-
126
-
127
-
128
-
 129
129 -
 130
130 -
 131
131 -
 132
132 -
 133
133 -
 134
134 -
 135
135 -
 136
136 -
 137
137 -
 138
138 -
 139
139 -
 140
140 -
 141
141 -
 142
142 -
 143
143 -
 144
144 -
 145
145 -
 146
146 -
 147
147 -
 148
148 -
 149
149 -
150
-
151
-
152
-
153
-
154
-
155
-
156
-
157
-
158
-
159
-
160
-
161
-
162
-
163
-
164
-
165
-
166
-
167
-
168
-
169
-
170
-
171
-
172
-
173
-
174
-
175
-
176
-
177
-
178
-
179
-
180
-
181
-
182
-
183
-
184
-
185
-
186
-
187
-
188
-
189
-
190
-
191
-
192
 |
 |

HEWLETT-PACKARD COMPANY AND SUBSIDIARIES
Notes to Consolidated Financial Statements (Continued)
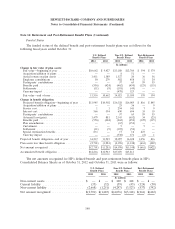
Note 14: Taxes on Earnings (Continued)
The significant components of deferred tax assets and deferred tax liabilities were as follows for
the following fiscal years ended October 31:
2012 2011
Deferred Deferred Deferred Deferred
Tax Tax Tax Ta x
Assets Liabilities Assets Liabilities
In millions
Loss carryforwards ............................... $ 9,142 $ — $ 9,793 $ —
Credit carryforwards .............................. 3,884 — 2,739 —
Unremitted earnings of foreign subsidiaries ............. — 7,559 — 8,209
Inventory valuation ............................... 185 12 236 12
Intercompany transactions—profit in inventory ........... 463 — 418 —
Intercompany transactions—excluding inventory .......... 881 — 1,529 —
Fixed assets .................................... 349 65 486 63
Warranty ...................................... 663 — 747 —
Employee and retiree benefits ....................... 3,264 16 2,559 18
Accounts receivable allowance ....................... 161 2 262 2
Capitalized research and development ................. 16 — 294 —
Purchased intangible assets ......................... 264 1,111 125 2,738
Restructuring ................................... 225 — 233 —
Equity investments ............................... 25 7 58 6
Deferred revenue ................................ 969 16 1,025 38
Other ........................................ 1,066 360 1,325 233
Gross deferred tax assets and liabilities ................ 21,557 9,148 21,829 11,319
Valuation allowance .............................. (10,223) — (9,057) —
Total deferred tax assets and liabilities ................. $11,334 $9,148 $12,772 $11,319
The decline in deferred tax liabilities associated with purchased intangible assets was primarily
attributable to the impairment of purchased intangible assets during the fiscal year.
The breakdown between current and long-term deferred tax assets and deferred tax liabilities was
as follows for the following fiscal years ended October 31:
2012 2011
In millions
Current deferred tax assets .......................................... $3,783 $ 5,374
Current deferred tax liabilities ....................................... (230) (41)
Long-term deferred tax assets ........................................ 1,581 1,283
Long-term deferred tax liabilities ..................................... (2,948) (5,163)
Total deferred tax assets net of deferred tax liabilities ...................... $2,186 $ 1,453
The decline in long-term deferred tax liabilities was primarily attributable to reversals of deferred
income tax liabilities attributable to impaired purchased intangible assets (as noted above) and
temporary basis differences related to certain foreign subsidiaries that were reduced by the impairment
charges for goodwill.
131