HP 2012 Annual Report Download - page 173
Download and view the complete annual report
Please find page 173 of the 2012 HP annual report below. You can navigate through the pages in the report by either clicking on the pages listed below, or by using the keyword search tool below to find specific information within the annual report.-
 1
1 -
2
-
3
-
4
-
5
-
6
-
7
-
8
-
9
-
10
-
11
-
12
-
13
-
14
-
15
-
16
-
17
-
18
-
19
-
20
-
21
-
22
-
23
-
24
-
25
-
26
-
27
-
28
-
29
-
30
-
31
-
32
-
33
-
34
-
35
-
36
-
37
-
38
-
39
-
40
-
41
-
42
-
43
-
44
-
45
-
46
-
47
-
48
-
49
-
50
-
51
-
52
-
53
-
54
-
55
-
56
-
57
-
58
-
59
-
60
-
61
-
62
-
63
-
64
-
65
-
66
-
67
-
68
-
69
-
70
-
71
-
72
-
73
-
74
-
75
-
76
-
77
-
78
-
79
-
80
-
81
-
82
-
83
-
84
-
85
-
86
-
87
-
88
-
89
-
90
-
91
-
92
-
93
-
94
-
95
-
96
-
97
-
98
-
99
-
100
-
101
-
102
-
103
-
104
-
105
-
106
-
107
-
108
-
109
-
110
-
111
-
112
-
113
-
114
-
115
-
116
-
117
-
118
-
119
-
120
-
121
-
122
-
123
-
124
-
125
-
126
-
127
-
128
-
129
-
130
-
131
-
132
-
133
-
134
-
135
-
136
-
137
-
138
-
139
-
140
-
141
-
142
-
143
-
144
-
145
-
146
-
147
-
148
-
149
-
150
-
151
-
152
-
153
-
154
-
155
-
156
-
157
-
158
-
159
-
160
-
161
-
162
-
 163
163 -
 164
164 -
 165
165 -
 166
166 -
 167
167 -
 168
168 -
 169
169 -
 170
170 -
 171
171 -
 172
172 -
 173
173 -
 174
174 -
 175
175 -
 176
176 -
 177
177 -
 178
178 -
 179
179 -
 180
180 -
 181
181 -
 182
182 -
 183
183 -
184
-
185
-
186
-
187
-
188
-
189
-
190
-
191
-
192
 |
 |

HEWLETT-PACKARD COMPANY AND SUBSIDIARIES
Notes to Consolidated Financial Statements (Continued)
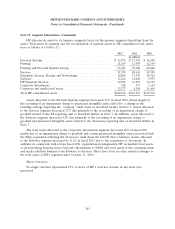
Note 19: Segment Information (Continued)
HP allocates its assets to its business segments based on the primary segments benefiting from the
assets. Total assets by segment and the reconciliation of segment assets to HP consolidated total assets
were as follows at October 31:
2012 2011 2010
In millions
Personal Systems ....................................... $ 12,752 $ 15,781 $ 16,548
Printing ............................................. 11,169 11,939 12,514
Printing and Personal Systems Group ........................ 23,921 27,720 29,062
Services ............................................. 31,234 40,614 41,989
Enterprise Servers, Storage and Networking ................... 16,000 17,539 18,262
Software ............................................. 12,264 21,028 9,979
HP Financial Services ................................... 12,924 13,543 12,123
Corporate Investments .................................. 248 517 1,619
Corporate and unallocated assets ........................... 12,177 8,556 11,469
Total HP consolidated assets .............................. $108,768 $129,517 $124,503
Assets allocated to the Personal Systems segment decreased 19% in fiscal 2012 driven largely by
the recording of an impairment charge to purchased intangible assets related to a change in the
branding strategy impacting the ‘‘Compaq’’ trade name as described further in Note 7. Assets allocated
to the Services segment decreased 23% due primarily to the recording of an impairment charge to
goodwill related to the ES reporting unit as described further in Note 7. In addition, assets allocated to
the Software segment decreased 42% due primarily to the recording of an impairment charge to
goodwill and purchased intangible assets related to the Autonomy reporting unit as described further in
Note 7.
The total assets allocated to the Corporate Investments segment decreased 68% in fiscal 2011
mostly due to an impairment charge to goodwill and certain purchased intangible assets associated with
the Palm acquisition following the decision to wind down the webOS device business. Assets allocated
to the Software segment increased by 111% in fiscal 2011 due to the acquisition of Autonomy. In
addition, in connection with certain fiscal 2011 organizational realignments, HP reclassified total assets
of its networking business from Corporate Investments to ESSN and total assets of the communications
and media solutions business from Software to Services. There have been no other material changes to
the total assets of HP’s segments since October 31, 2010.
Major Customers
No single customer represented 10% or more of HP’s total net revenue in any fiscal year
presented.
165