HP 2012 Annual Report Download - page 122
Download and view the complete annual report
Please find page 122 of the 2012 HP annual report below. You can navigate through the pages in the report by either clicking on the pages listed below, or by using the keyword search tool below to find specific information within the annual report.-
 1
1 -
2
-
3
-
4
-
5
-
6
-
7
-
8
-
9
-
10
-
11
-
12
-
13
-
14
-
15
-
16
-
17
-
18
-
19
-
20
-
21
-
22
-
23
-
24
-
25
-
26
-
27
-
28
-
29
-
30
-
31
-
32
-
33
-
34
-
35
-
36
-
37
-
38
-
39
-
40
-
41
-
42
-
43
-
44
-
45
-
46
-
47
-
48
-
49
-
50
-
51
-
52
-
53
-
54
-
55
-
56
-
57
-
58
-
59
-
60
-
61
-
62
-
63
-
64
-
65
-
66
-
67
-
68
-
69
-
70
-
71
-
72
-
73
-
74
-
75
-
76
-
77
-
78
-
79
-
80
-
81
-
82
-
83
-
84
-
85
-
86
-
87
-
88
-
89
-
90
-
91
-
92
-
93
-
94
-
95
-
96
-
97
-
98
-
99
-
100
-
101
-
102
-
103
-
104
-
105
-
106
-
107
-
108
-
109
-
110
-
111
-
 112
112 -
 113
113 -
 114
114 -
 115
115 -
 116
116 -
 117
117 -
 118
118 -
 119
119 -
 120
120 -
 121
121 -
 122
122 -
 123
123 -
 124
124 -
 125
125 -
 126
126 -
 127
127 -
 128
128 -
 129
129 -
 130
130 -
 131
131 -
 132
132 -
133
-
134
-
135
-
136
-
137
-
138
-
139
-
140
-
141
-
142
-
143
-
144
-
145
-
146
-
147
-
148
-
149
-
150
-
151
-
152
-
153
-
154
-
155
-
156
-
157
-
158
-
159
-
160
-
161
-
162
-
163
-
164
-
165
-
166
-
167
-
168
-
169
-
170
-
171
-
172
-
173
-
174
-
175
-
176
-
177
-
178
-
179
-
180
-
181
-
182
-
183
-
184
-
185
-
186
-
187
-
188
-
189
-
190
-
191
-
192
 |
 |
HEWLETT-PACKARD COMPANY AND SUBSIDIARIES
Notes to Consolidated Financial Statements (Continued)
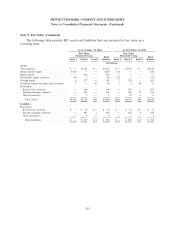
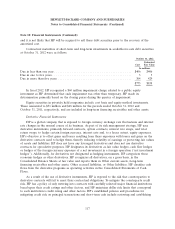
Note 9: Fair Value (Continued)
long-term debt was approximately $31.1 billion at October 31, 2011, compared to a carrying value of
$30.6 billion at that date. If measured at fair value in the Consolidated Balance Sheets, short- and
long-term debt would be classified as Level 2 in the fair value hierarchy.
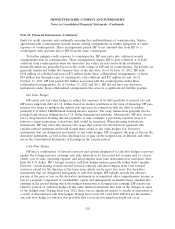
HP’s non-marketable equity investments and non-financial assets, such as intangible assets,
goodwill and property, plant and equipment, are recorded at fair value only if an impairment charge is
recognized. For the fiscal year ended October 31, 2012, HP recognized a goodwill and intangible asset
impairment charge of $8.8 billion associated with the Autonomy reporting unit within the Software
segment, a goodwill impairment charge of $8.0 billion associated with the ES reporting unit within the
Services segment and an intangible asset impairment charge of $1.2 billion associated with the
‘‘Compaq’’ trade name within the Personal Systems segment.
The remeasurement of goodwill is classified as a Level 3 fair value assessment due to the
significance of unobservable inputs developed using company-specific information. HP used the income
approach to measure the fair value of the ES and Autonomy reporting units. Under the income
approach, HP calculates the fair value of a reporting unit based on the present value of the estimated
future cash flows. Cash flow projections are based on management’s estimates of revenue growth rates
and operating margins, taking into consideration industry and market conditions. The discount rate
used is based on the weighted-average cost of capital adjusted for the relevant risk associated with
business-specific characteristics and the uncertainty related to the business’s ability to execute on the
projected cash flows. The discount rate also reflects adjustments required when comparing the sum of
the fair values of HP’s reporting units to HP’s market capitalization as discussed in Note 7. The
unobservable inputs used to fair value these reporting units include projected revenue growth rates,
profitability and the risk factor added to the discount rate.
The inputs used to measure the fair value of the intangible assets of Autonomy and the ‘‘Compaq’’
trade name were largely unobservable, and, accordingly, these measurements were classified as Level 3.
The fair value of the intangible assets for Autonomy was estimated using the income approach, which is
based on management’s cash flow projections of revenue growth rates and operating margins, taking
into consideration industry and market conditions. HP estimated the fair value of the ‘‘Compaq’’ trade
name by calculating the present value of the royalties saved that would have been paid to a third party
had HP not owned the trade name. The discount rates used in the fair value calculations for the
Autonomy intangibles and the ‘‘Compaq’’ trade name were based on a weighted average cost of capital
adjusted for the relevant risk associated with those assets. The unobservable inputs used in these
valuations include projected revenue growth rates, operating margins, royalty rates and the risk factor
added to the discount rate. The discount rates ranged from 11% to 16%. Projected revenue growth
rates ranged from (61)% to 13%. The (61)% rate reflects the significant decline in expected future
revenues for Compaq-branded products from fiscal year 2013 to fiscal year 2014 due to the change in
branding strategy discussed in Note 7.
For more information on these impairments measured as nonrecurring fair value adjustments, see
Note 7.
114