HP 2012 Annual Report Download - page 68
Download and view the complete annual report
Please find page 68 of the 2012 HP annual report below. You can navigate through the pages in the report by either clicking on the pages listed below, or by using the keyword search tool below to find specific information within the annual report.-
 1
1 -
2
-
3
-
4
-
5
-
6
-
7
-
8
-
9
-
10
-
11
-
12
-
13
-
14
-
15
-
16
-
17
-
18
-
19
-
20
-
21
-
22
-
23
-
24
-
25
-
26
-
27
-
28
-
29
-
30
-
31
-
32
-
33
-
34
-
35
-
36
-
37
-
38
-
39
-
40
-
41
-
42
-
43
-
44
-
45
-
46
-
47
-
48
-
49
-
50
-
51
-
52
-
53
-
54
-
55
-
56
-
57
-
 58
58 -
 59
59 -
 60
60 -
 61
61 -
 62
62 -
 63
63 -
 64
64 -
 65
65 -
 66
66 -
 67
67 -
 68
68 -
 69
69 -
 70
70 -
 71
71 -
 72
72 -
 73
73 -
 74
74 -
 75
75 -
 76
76 -
 77
77 -
 78
78 -
79
-
80
-
81
-
82
-
83
-
84
-
85
-
86
-
87
-
88
-
89
-
90
-
91
-
92
-
93
-
94
-
95
-
96
-
97
-
98
-
99
-
100
-
101
-
102
-
103
-
104
-
105
-
106
-
107
-
108
-
109
-
110
-
111
-
112
-
113
-
114
-
115
-
116
-
117
-
118
-
119
-
120
-
121
-
122
-
123
-
124
-
125
-
126
-
127
-
128
-
129
-
130
-
131
-
132
-
133
-
134
-
135
-
136
-
137
-
138
-
139
-
140
-
141
-
142
-
143
-
144
-
145
-
146
-
147
-
148
-
149
-
150
-
151
-
152
-
153
-
154
-
155
-
156
-
157
-
158
-
159
-
160
-
161
-
162
-
163
-
164
-
165
-
166
-
167
-
168
-
169
-
170
-
171
-
172
-
173
-
174
-
175
-
176
-
177
-
178
-
179
-
180
-
181
-
182
-
183
-
184
-
185
-
186
-
187
-
188
-
189
-
190
-
191
-
192
 |
 |

HEWLETT-PACKARD COMPANY AND SUBSIDIARIES
Management’s Discussion and Analysis of
Financial Condition and Results of Operations (Continued)
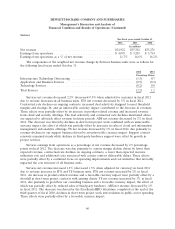
Services
For fiscal years ended October 31
2012 2011 2010
In millions
Net revenue ........................................... $34,922 $35,702 $35,276
Earnings from operations ................................. $ 4,095 $ 5,203 $ 5,714
Earnings from operations as a % of net revenue ................ 11.7% 14.6% 16.2%
The components of the weighted net revenue change by Services business units were as follows for
the following fiscal years ended October 31:
2012 2011
Percentage Points
Infrastructure Technology Outsourcing ................................... (1.5) 0.7
Application and Business Services ....................................... (0.5) (0.3)
Technology Services ................................................. (0.2) 0.8
Total Services ..................................................... (2.2) 1.2
Services net revenue decreased 2.2% (decreased 0.5% when adjusted for currency) in fiscal 2012
due to revenue decreases in all business units. ITO net revenue decreased by 3% in fiscal 2012.
Contractual rate declines on ongoing contracts, increased deal selectivity designed to meet threshold
margins and strategic fit, and an unfavorable currency impact contributed to the decrease in revenues.
These effects were partially offset by an increase in product-related revenue and increased revenue
from cloud and security offerings. The deal selectivity and contractual rate declines mentioned above
are expected to adversely affect revenue in future periods. ABS net revenue decreased by 2% in fiscal
2012. The decrease was driven by declines in short-term project work combined with an unfavorable
currency impact, the effect of which was partially offset by increases in sales of cloud and information
management and analytics offerings. TS net revenue decreased by 1% in fiscal 2012, due primarily to
revenue declines in our support business driven by an unfavorable currency impact. Support contract
renewals remained steady while declines in third-party hardware support were offset by growth in
project services.
Services earnings from operations as a percentage of net revenue decreased by 2.9 percentage
points in fiscal 2012. The decrease was due primarily to a gross margin decline driven by lower than
expected revenue, contractual rate declines on ongoing contracts, a lower than expected resource
utilization rate and additional costs associated with certain contract deliverable delays. These effects
were partially offset by a continued focus on operating improvements and cost initiatives that favorably
impacted the cost structure of all business units.
Services net revenue increased 1.2% (decreased 1.3% when adjusted for currency) in fiscal 2011
due to revenue increases in ITO and TS business units. ITO net revenue increased by 2% in fiscal
2011. An increase in product-related revenue and a favorable currency impact were partially offset by a
shortfall in short-term project contracts with existing clients. TS net revenue increased by 3% in fiscal
2011, due primarily to growth in our consulting business and a favorable currency impact, the effect of
which was partially offset by reduced sales of third-party hardware. ABS net revenue decreased by 1%
in fiscal 2011. The decrease was driven by the ExcellerateHRO divestiture completed at the end of the
third quarter of fiscal 2010, declines in short-term project work and weakness in public sector spending.
These effects were partially offset by a favorable currency impact.
60