HP 2012 Annual Report Download - page 60
Download and view the complete annual report
Please find page 60 of the 2012 HP annual report below. You can navigate through the pages in the report by either clicking on the pages listed below, or by using the keyword search tool below to find specific information within the annual report.-
 1
1 -
2
-
3
-
4
-
5
-
6
-
7
-
8
-
9
-
10
-
11
-
12
-
13
-
14
-
15
-
16
-
17
-
18
-
19
-
20
-
21
-
22
-
23
-
24
-
25
-
26
-
27
-
28
-
29
-
30
-
31
-
32
-
33
-
34
-
35
-
36
-
37
-
38
-
39
-
40
-
41
-
42
-
43
-
44
-
45
-
46
-
47
-
48
-
49
-
 50
50 -
 51
51 -
 52
52 -
 53
53 -
 54
54 -
 55
55 -
 56
56 -
 57
57 -
 58
58 -
 59
59 -
 60
60 -
 61
61 -
 62
62 -
 63
63 -
 64
64 -
 65
65 -
 66
66 -
 67
67 -
 68
68 -
 69
69 -
 70
70 -
71
-
72
-
73
-
74
-
75
-
76
-
77
-
78
-
79
-
80
-
81
-
82
-
83
-
84
-
85
-
86
-
87
-
88
-
89
-
90
-
91
-
92
-
93
-
94
-
95
-
96
-
97
-
98
-
99
-
100
-
101
-
102
-
103
-
104
-
105
-
106
-
107
-
108
-
109
-
110
-
111
-
112
-
113
-
114
-
115
-
116
-
117
-
118
-
119
-
120
-
121
-
122
-
123
-
124
-
125
-
126
-
127
-
128
-
129
-
130
-
131
-
132
-
133
-
134
-
135
-
136
-
137
-
138
-
139
-
140
-
141
-
142
-
143
-
144
-
145
-
146
-
147
-
148
-
149
-
150
-
151
-
152
-
153
-
154
-
155
-
156
-
157
-
158
-
159
-
160
-
161
-
162
-
163
-
164
-
165
-
166
-
167
-
168
-
169
-
170
-
171
-
172
-
173
-
174
-
175
-
176
-
177
-
178
-
179
-
180
-
181
-
182
-
183
-
184
-
185
-
186
-
187
-
188
-
189
-
190
-
191
-
192
 |
 |

HEWLETT-PACKARD COMPANY AND SUBSIDIARIES
Management’s Discussion and Analysis of
Financial Condition and Results of Operations (Continued)
acquisition of Palm, Inc. on July 1, 2010 recorded as result of the decision announced on
August 18, 2011 to wind down the webOS device business.
(4) For fiscal 2011, includes $276 million of charges in connection with the acquisition of Autonomy,
which is primarily comprised of the $265 million net cost of British pound options bought to limit
foreign exchange rate risk.
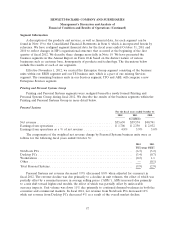
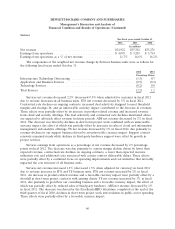
Net Revenue
The components of the weighted net revenue change were as follows for the following fiscal years
ended October 31:
2012 2011(1)
Percentage Points
Personal Systems .................................................. (3.1) (0.9)
Printing ......................................................... (1.3) —
Enterprise Servers, Storage and Networking ............................... (1.2) 1.5
Services ......................................................... (0.6) 0.3
Corporate Investments/Other ......................................... 0.1 (0.7)
HP Financial Services ............................................... 0.2 0.4
Software ........................................................ 0.5 0.4
Total HP ........................................................ (5.4) 1.0
(1) Reflects certain reclassifications made to historical results to conform to the current year
presentation as noted in Note 19 to the Consolidated Financial Statements in Item 8.
Fiscal 2012
In fiscal 2012, total HP net revenue decreased 5.4% (decreased 4.4% on a constant currency
basis). U.S. net revenue decreased 4.5% to $42.1 billion, while net revenue from outside of the United
States decreased 5.9% to $78.2 billion. HP’s revenue decreased due primarily to a weak customer
demand environment resulting in volume declines in our hardware businesses and printing supplies
coupled with contractual rate declines on ongoing contracts in Services. The Software segment
contributed favorably to the total HP net revenue change as a result of the acquisition of Autonomy in
October 2011. An analysis of the change in net revenue for each business segment is included under
‘‘Segment Information’’ below.
Fiscal 2011
In fiscal 2011, total HP net revenue increased 1.0% (decreased 0.9% on a constant currency basis).
U.S. net revenue decreased 1.0% to $44.1 billion, while net revenue from outside of the United States
increased 2.0% to $83.1 billion. As reflected in the table above, the ESSN segment was the largest
contributor to HP net revenue growth as a result of balanced growth across all regions. ESSN segment
net revenue growth was helped by the strong performance in products related to our 3PAR Inc.
(‘‘3PAR’’) and 3Com Corporation (‘‘3Com’’) acquisitions. An analysis of the change in net revenue for
each business segment is included under ‘‘Segment Information’’ below.
52