HP 2012 Annual Report Download - page 153
Download and view the complete annual report
Please find page 153 of the 2012 HP annual report below. You can navigate through the pages in the report by either clicking on the pages listed below, or by using the keyword search tool below to find specific information within the annual report.-
 1
1 -
2
-
3
-
4
-
5
-
6
-
7
-
8
-
9
-
10
-
11
-
12
-
13
-
14
-
15
-
16
-
17
-
18
-
19
-
20
-
21
-
22
-
23
-
24
-
25
-
26
-
27
-
28
-
29
-
30
-
31
-
32
-
33
-
34
-
35
-
36
-
37
-
38
-
39
-
40
-
41
-
42
-
43
-
44
-
45
-
46
-
47
-
48
-
49
-
50
-
51
-
52
-
53
-
54
-
55
-
56
-
57
-
58
-
59
-
60
-
61
-
62
-
63
-
64
-
65
-
66
-
67
-
68
-
69
-
70
-
71
-
72
-
73
-
74
-
75
-
76
-
77
-
78
-
79
-
80
-
81
-
82
-
83
-
84
-
85
-
86
-
87
-
88
-
89
-
90
-
91
-
92
-
93
-
94
-
95
-
96
-
97
-
98
-
99
-
100
-
101
-
102
-
103
-
104
-
105
-
106
-
107
-
108
-
109
-
110
-
111
-
112
-
113
-
114
-
115
-
116
-
117
-
118
-
119
-
120
-
121
-
122
-
123
-
124
-
125
-
126
-
127
-
128
-
129
-
130
-
131
-
132
-
133
-
134
-
135
-
136
-
137
-
138
-
139
-
140
-
141
-
142
-
 143
143 -
 144
144 -
 145
145 -
 146
146 -
 147
147 -
 148
148 -
 149
149 -
 150
150 -
 151
151 -
 152
152 -
 153
153 -
 154
154 -
 155
155 -
 156
156 -
 157
157 -
 158
158 -
 159
159 -
 160
160 -
 161
161 -
 162
162 -
 163
163 -
164
-
165
-
166
-
167
-
168
-
169
-
170
-
171
-
172
-
173
-
174
-
175
-
176
-
177
-
178
-
179
-
180
-
181
-
182
-
183
-
184
-
185
-
186
-
187
-
188
-
189
-
190
-
191
-
192
 |
 |

HEWLETT-PACKARD COMPANY AND SUBSIDIARIES
Notes to Consolidated Financial Statements (Continued)
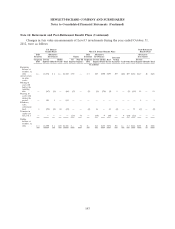
Note 16: Retirement and Post-Retirement Benefit Plans (Continued)
Changes in fair value measurements of Level 3 investments during the year ended October 31,
2011, were as follows:
U.S. Defined Post-Retirement
Benefit Plans Non-U.S. Defined Benefit Plans Benefit Plans
Alternative Debt Alternative Alternative
Investments Equity Securities Investments Investments
Insurance
Private US Corporate Private Hedge Real Group Private
Equities Hybrids Total Equities Debt Equities Funds Estate Annuities Cash Other Total Equities Hybrids Total
In millions
Beginning balance at
October 31, 2010 .... $1,034 $ 6 $1,040 $ 64 $ 6 $14 $231 $225 $ 74 $— $ 2 $616 $154 $ 1 $155
Actual return on plan
assets:
Relating to assets still
held at the reporting
date ........... 127 — 127 30 — 3 (26) (26) 17 — — (2) 32 — 32
Relating to assets sold
during the period . . . 154 1 155 — — — — — — — (1) (1) 18 — 18
Purchases, sales,
settlements (net) .... (29) (1) (30) — 1 3 30 — (18) — (1) 15 23 — 23
Transfers in and/or out of
Level 3 ......... 70 (2) 68 (64) (4) — 65 — 16 (4) 19 28 — — —
Ending balance at
October 31, 2011 .... $1,356 $ 4 $1,360 $ 30 $ 3 $20 $300 $199 $ 89 $ (4) $19 $656 $227 $ 1 $228
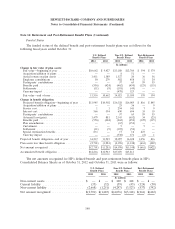
Plan Asset Valuations
The following is a description of the valuation methodologies used for pension plan assets
measured at fair value. There have been no changes in the methodologies used during the reporting
period.
Investments in securities are valued at the closing price reported on the stock exchange in which
the individual securities are traded. For corporate, government and asset-backed debt securities, fair
value is based upon observable inputs of comparable market transactions. For corporate and
government debt securities traded on active exchanges, fair value is based upon observable quoted
prices. Underlying assets for alternative investments such as limited partnerships, joint ventures and
private equities are determined by the general partner or the general partner’s designee on a quarter or
periodic basis. Common collective trusts, interest in 103-12 entities and registered investment
companies are valued at the net asset value established by the funds sponsor, based upon fair value of
the assets underlying the funds. The valuation for some of these assets requires judgment due to the
absence of quoted market prices, and these assets are therefore classified as Level 3. Cash and cash
equivalents includes money market accounts, which are valued based on the net asset value of the
shares. Other assets were valued based upon the level of input (e.g., quoted prices, observable inputs
(other than Level 1) or unobservable inputs that were significant to the fair value measurement of the
assets).
145