HP 2012 Annual Report Download - page 51
Download and view the complete annual report
Please find page 51 of the 2012 HP annual report below. You can navigate through the pages in the report by either clicking on the pages listed below, or by using the keyword search tool below to find specific information within the annual report.-
 1
1 -
2
-
3
-
4
-
5
-
6
-
7
-
8
-
9
-
10
-
11
-
12
-
13
-
14
-
15
-
16
-
17
-
18
-
19
-
20
-
21
-
22
-
23
-
24
-
25
-
26
-
27
-
28
-
29
-
30
-
31
-
32
-
33
-
34
-
35
-
36
-
37
-
38
-
39
-
40
-
 41
41 -
 42
42 -
 43
43 -
 44
44 -
 45
45 -
 46
46 -
 47
47 -
 48
48 -
 49
49 -
 50
50 -
 51
51 -
 52
52 -
 53
53 -
 54
54 -
 55
55 -
 56
56 -
 57
57 -
 58
58 -
 59
59 -
 60
60 -
 61
61 -
62
-
63
-
64
-
65
-
66
-
67
-
68
-
69
-
70
-
71
-
72
-
73
-
74
-
75
-
76
-
77
-
78
-
79
-
80
-
81
-
82
-
83
-
84
-
85
-
86
-
87
-
88
-
89
-
90
-
91
-
92
-
93
-
94
-
95
-
96
-
97
-
98
-
99
-
100
-
101
-
102
-
103
-
104
-
105
-
106
-
107
-
108
-
109
-
110
-
111
-
112
-
113
-
114
-
115
-
116
-
117
-
118
-
119
-
120
-
121
-
122
-
123
-
124
-
125
-
126
-
127
-
128
-
129
-
130
-
131
-
132
-
133
-
134
-
135
-
136
-
137
-
138
-
139
-
140
-
141
-
142
-
143
-
144
-
145
-
146
-
147
-
148
-
149
-
150
-
151
-
152
-
153
-
154
-
155
-
156
-
157
-
158
-
159
-
160
-
161
-
162
-
163
-
164
-
165
-
166
-
167
-
168
-
169
-
170
-
171
-
172
-
173
-
174
-
175
-
176
-
177
-
178
-
179
-
180
-
181
-
182
-
183
-
184
-
185
-
186
-
187
-
188
-
189
-
190
-
191
-
192
 |
 |
HEWLETT-PACKARD COMPANY AND SUBSIDIARIES
Management’s Discussion and Analysis of
Financial Condition and Results of Operations (Continued)
We recognize revenue on certain design and build (design, development and/or constructions of
software and/or systems) projects using the percentage-of-completion method. We use the cost-to-cost
method of measurement towards completion as determined by the percentage of cost incurred to date
to the total estimated costs of the project. In circumstances when reasonable and reliable cost estimates
for a project cannot be made, we recognize revenue using the completed contract method.
We record estimated reductions to revenue for customer and distributor programs and incentive
offerings, including price protection, promotions, other volume-based incentives and expected returns.
Future market conditions and product transitions may require us to take actions to increase customer
incentive offerings, possibly resulting in an incremental reduction of revenue at the time the incentive is
offered. Additionally, certain incentive programs require us to estimate, based on historical experience
and the specific terms and conditions of the incentive, the number of customers who will actually
redeem the incentive.
Under our revenue recognition policies, we establish the selling prices used for each deliverable
based on the vendor-specific objective evidence (‘‘VSOE’’), if available, third-party evidence, if VSOE
is not available, or estimated selling price if neither VSOE nor third-party evidence is available. We
establish VSOE of selling price using the price charged for a deliverable when sold separately and, in
rare instances, using the price established by management having the relevant authority. Third-party
evidence of selling price is established by evaluating largely similar and interchangeable competitor
products or services in standalone sales to similarly situated customers. The best estimate of selling
price (‘‘ESP’’) is established considering internal factors such as margin objectives, pricing practices and
controls, customer segment pricing strategies and the product life cycle. Consideration is also given to
market conditions such as competitor pricing strategies and industry technology life cycles. When
determining ESP, we apply management judgment to establish margin objectives and pricing strategies
and to evaluate market conditions and product life cycles. We may modify or develop new go-to-market
practices in the future. As these go-to-market strategies evolve, we may modify our pricing practices in
the future, which may result in changes in selling prices, impacting both VSOE and ESP. The
aforementioned factors may result in a different allocation of revenue to the deliverables in multiple
element arrangements from the current fiscal year, which may change the pattern and timing of
revenue recognition for these elements but will not change the total revenue recognized for the
arrangement.
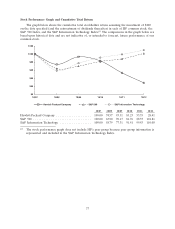
Warranty Provision
We provide for the estimated cost of product warranties at the time we recognize revenue. We
evaluate our warranty obligations on a product group basis. Our standard product warranty terms
generally include post-sales support and repairs or replacement of a product at no additional charge for
a specified period of time. While we engage in extensive product quality programs and processes,
including actively monitoring and evaluating the quality of our component suppliers, we base our
estimated warranty obligation upon warranty terms, ongoing product failure rates, repair costs, product
call rates, average cost per call, and current period product shipments. If actual product failure rates,
repair rates or any other post sales support costs were to differ from our estimates, we would be
required to make revisions to the estimated warranty liability. Warranty terms generally range from
90 days to three years for parts and labor, depending upon the product. Over the last three fiscal years,
the annual warranty provision and actual warranty costs have averaged approximately 3.1% of annual
net product revenue.
43