HP 2012 Annual Report Download - page 108
Download and view the complete annual report
Please find page 108 of the 2012 HP annual report below. You can navigate through the pages in the report by either clicking on the pages listed below, or by using the keyword search tool below to find specific information within the annual report.-
 1
1 -
2
-
3
-
4
-
5
-
6
-
7
-
8
-
9
-
10
-
11
-
12
-
13
-
14
-
15
-
16
-
17
-
18
-
19
-
20
-
21
-
22
-
23
-
24
-
25
-
26
-
27
-
28
-
29
-
30
-
31
-
32
-
33
-
34
-
35
-
36
-
37
-
38
-
39
-
40
-
41
-
42
-
43
-
44
-
45
-
46
-
47
-
48
-
49
-
50
-
51
-
52
-
53
-
54
-
55
-
56
-
57
-
58
-
59
-
60
-
61
-
62
-
63
-
64
-
65
-
66
-
67
-
68
-
69
-
70
-
71
-
72
-
73
-
74
-
75
-
76
-
77
-
78
-
79
-
80
-
81
-
82
-
83
-
84
-
85
-
86
-
87
-
88
-
89
-
90
-
91
-
92
-
93
-
94
-
95
-
96
-
97
-
 98
98 -
 99
99 -
 100
100 -
 101
101 -
 102
102 -
 103
103 -
 104
104 -
 105
105 -
 106
106 -
 107
107 -
 108
108 -
 109
109 -
 110
110 -
 111
111 -
 112
112 -
 113
113 -
 114
114 -
 115
115 -
 116
116 -
 117
117 -
 118
118 -
119
-
120
-
121
-
122
-
123
-
124
-
125
-
126
-
127
-
128
-
129
-
130
-
131
-
132
-
133
-
134
-
135
-
136
-
137
-
138
-
139
-
140
-
141
-
142
-
143
-
144
-
145
-
146
-
147
-
148
-
149
-
150
-
151
-
152
-
153
-
154
-
155
-
156
-
157
-
158
-
159
-
160
-
161
-
162
-
163
-
164
-
165
-
166
-
167
-
168
-
169
-
170
-
171
-
172
-
173
-
174
-
175
-
176
-
177
-
178
-
179
-
180
-
181
-
182
-
183
-
184
-
185
-
186
-
187
-
188
-
189
-
190
-
191
-
192
 |
 |

HEWLETT-PACKARD COMPANY AND SUBSIDIARIES
Notes to Consolidated Financial Statements (Continued)
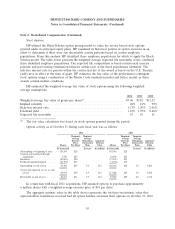
Note 3: Net Earnings Per Share (Continued)
The reconciliation of the numerators and denominators of the basic and diluted earnings and loss
per share calculations was as follows for the following fiscal years ended October 31:
2012 2011 2010
In millions, except per share
amounts
Numerator:
Net (loss) earnings(1) ...................................... $(12,650) $7,074 $8,761
Denominator:
Weighted-average shares used to compute basic EPS ............... 1,974 2,094 2,319
Dilutive effect of employee stock plans(2) ....................... — 34 53
Weighted-average shares used to compute diluted EPS(2) ............ 1,974 2,128 2,372
Net (loss) earnings per share:
Basic ................................................. $ (6.41) $ 3.38 $ 3.78
Diluted(2) .............................................. $ (6.41) $ 3.32 $ 3.69
(1) Net (loss) earnings available to participating securities were not significant for fiscal years 2012,
2011 and 2010. HP considers restricted stock that provides the holder with a non-forfeitable right
to receive dividends to be a participating security.
(2) For the fiscal year 2012, HP excluded from the calculation of diluted loss per share 10 million
shares potentially issuable under employee stock plans, as their effect, if included, would have been
anti-dilutive.
HP excludes options with exercise prices that are greater than the average market price from the
calculation of diluted earnings per share because their effect would be anti-dilutive. In fiscal years 2012,
2011 and 2010, HP excluded from the calculation of diluted earnings (loss) per share options to
purchase 56 million shares, 25 million shares and 5 million shares, respectively. In addition, HP also
excluded from the calculation of diluted earnings (loss) per share options to purchase an additional
1 million shares, 1 million shares and 2 million shares in fiscal years 2012, 2011 and 2010, respectively,
whose combined exercise price, unamortized fair value and excess tax benefits were greater in each of
those periods than the average market price for HP’s common stock because their effect would be
anti-dilutive.
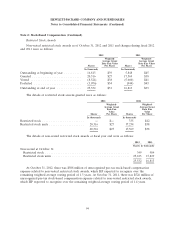
Note 4: Balance Sheet Details
Balance sheet details were as follows for the following fiscal years ended October 31:
Accounts and Financing Receivables
2012 2011
In millions
Accounts receivable ............................................... $16,871 $18,694
Allowance for doubtful accounts ..................................... (464) (470)
$16,407 $18,224
100