HP 2012 Annual Report Download - page 69
Download and view the complete annual report
Please find page 69 of the 2012 HP annual report below. You can navigate through the pages in the report by either clicking on the pages listed below, or by using the keyword search tool below to find specific information within the annual report.-
 1
1 -
2
-
3
-
4
-
5
-
6
-
7
-
8
-
9
-
10
-
11
-
12
-
13
-
14
-
15
-
16
-
17
-
18
-
19
-
20
-
21
-
22
-
23
-
24
-
25
-
26
-
27
-
28
-
29
-
30
-
31
-
32
-
33
-
34
-
35
-
36
-
37
-
38
-
39
-
40
-
41
-
42
-
43
-
44
-
45
-
46
-
47
-
48
-
49
-
50
-
51
-
52
-
53
-
54
-
55
-
56
-
57
-
58
-
 59
59 -
 60
60 -
 61
61 -
 62
62 -
 63
63 -
 64
64 -
 65
65 -
 66
66 -
 67
67 -
 68
68 -
 69
69 -
 70
70 -
 71
71 -
 72
72 -
 73
73 -
 74
74 -
 75
75 -
 76
76 -
 77
77 -
 78
78 -
 79
79 -
80
-
81
-
82
-
83
-
84
-
85
-
86
-
87
-
88
-
89
-
90
-
91
-
92
-
93
-
94
-
95
-
96
-
97
-
98
-
99
-
100
-
101
-
102
-
103
-
104
-
105
-
106
-
107
-
108
-
109
-
110
-
111
-
112
-
113
-
114
-
115
-
116
-
117
-
118
-
119
-
120
-
121
-
122
-
123
-
124
-
125
-
126
-
127
-
128
-
129
-
130
-
131
-
132
-
133
-
134
-
135
-
136
-
137
-
138
-
139
-
140
-
141
-
142
-
143
-
144
-
145
-
146
-
147
-
148
-
149
-
150
-
151
-
152
-
153
-
154
-
155
-
156
-
157
-
158
-
159
-
160
-
161
-
162
-
163
-
164
-
165
-
166
-
167
-
168
-
169
-
170
-
171
-
172
-
173
-
174
-
175
-
176
-
177
-
178
-
179
-
180
-
181
-
182
-
183
-
184
-
185
-
186
-
187
-
188
-
189
-
190
-
191
-
192
 |
 |

HEWLETT-PACKARD COMPANY AND SUBSIDIARIES
Management’s Discussion and Analysis of
Financial Condition and Results of Operations (Continued)
Services earnings from operations as a percentage of net revenue decreased by 1.6 percentage
points in fiscal 2011. Operating margin decreased due primarily to lower than expected revenue, rate
concessions arising from recent contract renewals, a lower than expected resource utilization rate and a
higher mix of lower-margin Infrastructure Technology Outsourcing revenue. The decrease in operating
margin was partially offset by a reduction in bad debt expense and a continued focus on operating
improvements and cost initiatives that favorably impacted the cost structure of both our enterprise
services and technology services businesses.
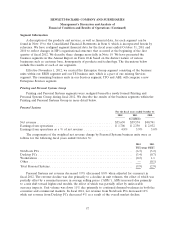
Enterprise Servers, Storage and Networking
For the fiscal years ended October 31
2012 2011 2010
In millions
Net revenue ........................................... $20,491 $22,064 $20,246
Earnings from operations ................................. $ 2,132 $ 2,997 $ 2,814
Earnings from operations as a % of net revenue ................ 10.4% 13.6% 13.9%
The components of the weighted net revenue change by ESSN business units were as follows for
the following fiscal years ended October 31:
2012 2011
Percentage Points
Industry Standard Servers ............................................. (4.2) 4.7
Business Critical Systems (‘‘BCS’’) ...................................... (2.2) (1.0)
Storage .......................................................... (1.1) 1.3
Networking ....................................................... 0.4 4.0
Total ESSN ....................................................... (7.1) 9.0
ESSN net revenue decreased 7.1% (6.4% when adjusted for currency) in fiscal 2012 due primarily
to revenue decreases in ISS, BCS and Storage. In fiscal 2012, ISS net revenue decreased by 7% driven
by declines in unit volume and average unit prices. The declines were due primarily to competitive
pricing pressures and macroeconomic challenges in EMEA. These effects were partially offset by
increased demand for public and private cloud offerings. BCS net revenue decreased by 23% in fiscal
2012 mainly as a result of lower demand for our Itanium-based servers, the impact of which was slightly
offset by growth in NonStop servers. Storage net revenue decreased 6% in fiscal 2012, due primarily to
revenue declines in storage tape and networking products, the effect of which was partially offset by
strong growth in 3PAR products and StoreOnce data deduplication solutions. Networking net revenue
increased 4% in fiscal 2012 due to higher market demand for our core data center products, the effect
of which was partially offset by competitive pricing pressures and the divestiture of our video
surveillance business.
ESSN earnings from operations as a percentage of net revenue decreased by 3.2 percentage points
in fiscal 2012 driven by a decrease in gross margin coupled with an increase in operating expenses as a
percentage of net revenue. The decrease in gross margin was due primarily to competitive pricing
pressures, particularly in ISS and, to a lesser extent, in Networking. The increase in operating expenses
as a percentage of net revenue was driven by an increase in research and development costs and field
selling costs, the effect of which was partially offset by lower administrative and marketing expenses.
61