HP 2012 Annual Report Download - page 71
Download and view the complete annual report
Please find page 71 of the 2012 HP annual report below. You can navigate through the pages in the report by either clicking on the pages listed below, or by using the keyword search tool below to find specific information within the annual report.-
 1
1 -
2
-
3
-
4
-
5
-
6
-
7
-
8
-
9
-
10
-
11
-
12
-
13
-
14
-
15
-
16
-
17
-
18
-
19
-
20
-
21
-
22
-
23
-
24
-
25
-
26
-
27
-
28
-
29
-
30
-
31
-
32
-
33
-
34
-
35
-
36
-
37
-
38
-
39
-
40
-
41
-
42
-
43
-
44
-
45
-
46
-
47
-
48
-
49
-
50
-
51
-
52
-
53
-
54
-
55
-
56
-
57
-
58
-
59
-
60
-
 61
61 -
 62
62 -
 63
63 -
 64
64 -
 65
65 -
 66
66 -
 67
67 -
 68
68 -
 69
69 -
 70
70 -
 71
71 -
 72
72 -
 73
73 -
 74
74 -
 75
75 -
 76
76 -
 77
77 -
 78
78 -
 79
79 -
 80
80 -
 81
81 -
82
-
83
-
84
-
85
-
86
-
87
-
88
-
89
-
90
-
91
-
92
-
93
-
94
-
95
-
96
-
97
-
98
-
99
-
100
-
101
-
102
-
103
-
104
-
105
-
106
-
107
-
108
-
109
-
110
-
111
-
112
-
113
-
114
-
115
-
116
-
117
-
118
-
119
-
120
-
121
-
122
-
123
-
124
-
125
-
126
-
127
-
128
-
129
-
130
-
131
-
132
-
133
-
134
-
135
-
136
-
137
-
138
-
139
-
140
-
141
-
142
-
143
-
144
-
145
-
146
-
147
-
148
-
149
-
150
-
151
-
152
-
153
-
154
-
155
-
156
-
157
-
158
-
159
-
160
-
161
-
162
-
163
-
164
-
165
-
166
-
167
-
168
-
169
-
170
-
171
-
172
-
173
-
174
-
175
-
176
-
177
-
178
-
179
-
180
-
181
-
182
-
183
-
184
-
185
-
186
-
187
-
188
-
189
-
190
-
191
-
192
 |
 |

HEWLETT-PACKARD COMPANY AND SUBSIDIARIES
Management’s Discussion and Analysis of
Financial Condition and Results of Operations (Continued)
Software earnings from operations as a percentage of net revenue decreased by 6.6 percentage
points in fiscal 2011. The operating margin decline was due primarily to the impact of deferred revenue
write-downs and integration costs associated with acquisitions and investments in sales coverage and
R&D, the effect of which was partially offset by the capitalization of certain software development
costs.
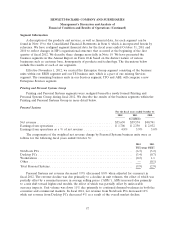
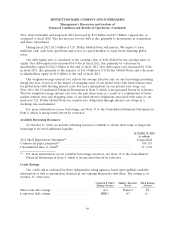
HP Financial Services
For the fiscal years ended October 31
2012 2011 2010
In millions
Net revenue .......................................... $3,819 $3,596 $3,047
Earnings from operations ................................ $ 388 $ 348 $ 281
Earnings from operations as a % of net revenue ................ 10.2% 9.7% 9.2%
HPFS net revenue increased by 6.2% in fiscal 2012. The net revenue increase was due primarily to
portfolio growth, along with higher buyout activity and higher end-of-lease revenue from residual
expirations in line with portfolio growth. The effects of these changes were partially offset by
unfavorable currency movements.
HPFS earnings from operations as a percentage of net revenue increased by 0.5 percentage points
in fiscal 2012. The increase was due primarily to an increase in gross margin. The increase in gross
margin was due primarily to lower bad debt expense, the effect of which was partially offset by lower
margins on end-of-term activities, including buyouts and lease extensions. Operating expenses as a
percentage of net revenue were flat due to our continued focus on cost efficiencies.
HPFS net revenue increased by 18.0% in fiscal 2011. The net revenue increase was due primarily
to portfolio growth as a result of higher customer demand, a higher operating lease mix due to higher
service-led financing volume, higher end-of-lease revenue from residual expirations in line with
portfolio growth, and higher early buyout revenue and favorable currency movements.
HPFS earnings from operations as a percentage of net revenue increased by 0.5 percentage points
in fiscal 2011 due primarily to a decrease in operating expenses as a percentage of revenue, the effect
of which was partially offset by a decrease in gross margin. The decrease in operating expenses was due
primarily to continued improvement in cost efficiencies. The decrease in gross margin was the result of
lower portfolio margins from a higher mix of operating leases, the effect of which was partially offset
by lower bad debt expense as a percentage of revenue and higher margins on lease extensions and
buyouts.
Financing Originations
For the fiscal years ended October 31
2012 2011 2010
In millions
Total financing originations ................................ $6,590 $6,765 $5,987
New financing originations, which represent the amount of financing provided to customers for
equipment and related software and services, including intercompany activity, decreased 2.6% and
increased 13.0% in fiscal 2012 and fiscal 2011, respectively. The decrease was driven by lower financing
associated with HP product sales and services offerings, along with unfavorable currency impact.
63