Cricket Wireless 2011 Annual Report Download - page 99
Download and view the complete annual report
Please find page 99 of the 2011 Cricket Wireless annual report below. You can navigate through the pages in the report by either clicking on the pages listed below, or by using the keyword search tool below to find specific information within the annual report.-
 1
1 -
2
-
3
-
4
-
5
-
6
-
7
-
8
-
9
-
10
-
11
-
12
-
13
-
14
-
15
-
16
-
17
-
18
-
19
-
20
-
21
-
22
-
23
-
24
-
25
-
26
-
27
-
28
-
29
-
30
-
31
-
32
-
33
-
34
-
35
-
36
-
37
-
38
-
39
-
40
-
41
-
42
-
43
-
44
-
45
-
46
-
47
-
48
-
49
-
50
-
51
-
52
-
53
-
54
-
55
-
56
-
57
-
58
-
59
-
60
-
61
-
62
-
63
-
64
-
65
-
66
-
67
-
68
-
69
-
70
-
71
-
72
-
73
-
74
-
75
-
76
-
77
-
78
-
79
-
80
-
81
-
82
-
83
-
84
-
85
-
86
-
87
-
88
-
 89
89 -
 90
90 -
 91
91 -
 92
92 -
 93
93 -
 94
94 -
 95
95 -
 96
96 -
 97
97 -
 98
98 -
 99
99 -
 100
100 -
 101
101 -
 102
102 -
 103
103 -
 104
104 -
 105
105 -
 106
106 -
 107
107 -
 108
108 -
 109
109 -
110
-
111
-
112
-
113
-
114
-
115
-
116
-
117
-
118
-
119
-
120
-
121
-
122
-
123
-
124
-
125
-
126
-
127
-
128
-
129
-
130
-
131
-
132
-
133
-
134
-
135
-
136
-
137
-
138
-
139
-
140
-
141
-
142
-
143
-
144
-
145
-
146
-
147
-
148
-
149
-
150
-
151
-
152
-
153
-
154
-
155
-
156
-
157
-
158
-
159
-
160
-
161
-
162
-
163
-
164
 |
 |

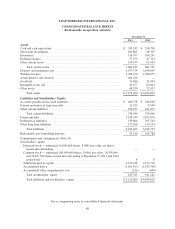
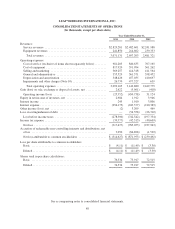
LEAP WIRELESS INTERNATIONAL, INC.
CONSOLIDATED STATEMENTS OF OPERATIONS
(In thousands, except per share data)
Year Ended December 31,
2011 2010 2009
Revenues:
Service revenues .......................................... $2,829,281 $2,482,601 $2,241,988
Equipment revenues ....................................... 241,850 214,602 239,333
Total revenues .......................................... 3,071,131 2,697,203 2,481,321
Operating expenses:
Cost of service (exclusive of items shown separately below) ........ 981,203 840,635 707,165
Cost of equipment ......................................... 817,920 591,994 561,262
Selling and marketing ...................................... 369,257 414,318 411,564
General and administrative .................................. 355,529 361,571 358,452
Depreciation and amortization ............................... 548,426 457,035 410,697
Impairments and other charges (Note 10) ....................... 26,770 477,327 639
Total operating expenses .................................. 3,099,105 3,142,880 2,449,779
Gain (loss) on sale, exchange or disposal of assets, net .............. 2,622 (5,061) (418)
Operating income (loss) .................................... (25,352) (450,738) 31,124
Equity in net income of investees, net ........................... 2,984 1,912 3,946
Interest income ............................................. 245 1,010 3,806
Interest expense ............................................. (256,175) (243,377) (210,389)
Other income (loss), net ...................................... (2) 3,209 469
Loss on extinguishment of debt ................................ — (54,558) (26,310)
Loss before income taxes ................................... (278,300) (742,542) (197,354)
Income tax expense .......................................... (39,377) (42,513) (40,609)
Net loss ................................................. (317,677) (785,055) (237,963)
Accretion of redeemable non-controlling interests and distributions, net
oftax ................................................... 3,050 (86,898) (1,529)
Net loss attributable to common stockholders ................... $ (314,627) $ (871,953) $ (239,492)
Loss per share attributable to common stockholders:
Basic ................................................... $ (4.11) $ (11.49) $ (3.30)
Diluted .................................................. $ (4.11) $ (11.49) $ (3.30)
Shares used in per share calculations:
Basic ................................................... 76,534 75,917 72,515
Diluted .................................................. 76,534 75,917 72,515
See accompanying notes to consolidated financial statements.
89