Cricket Wireless 2011 Annual Report Download - page 56
Download and view the complete annual report
Please find page 56 of the 2011 Cricket Wireless annual report below. You can navigate through the pages in the report by either clicking on the pages listed below, or by using the keyword search tool below to find specific information within the annual report.-
 1
1 -
2
-
3
-
4
-
5
-
6
-
7
-
8
-
9
-
10
-
11
-
12
-
13
-
14
-
15
-
16
-
17
-
18
-
19
-
20
-
21
-
22
-
23
-
24
-
25
-
26
-
27
-
28
-
29
-
30
-
31
-
32
-
33
-
34
-
35
-
36
-
37
-
38
-
39
-
40
-
41
-
42
-
43
-
44
-
45
-
 46
46 -
 47
47 -
 48
48 -
 49
49 -
 50
50 -
 51
51 -
 52
52 -
 53
53 -
 54
54 -
 55
55 -
 56
56 -
 57
57 -
 58
58 -
 59
59 -
 60
60 -
 61
61 -
 62
62 -
 63
63 -
 64
64 -
 65
65 -
 66
66 -
67
-
68
-
69
-
70
-
71
-
72
-
73
-
74
-
75
-
76
-
77
-
78
-
79
-
80
-
81
-
82
-
83
-
84
-
85
-
86
-
87
-
88
-
89
-
90
-
91
-
92
-
93
-
94
-
95
-
96
-
97
-
98
-
99
-
100
-
101
-
102
-
103
-
104
-
105
-
106
-
107
-
108
-
109
-
110
-
111
-
112
-
113
-
114
-
115
-
116
-
117
-
118
-
119
-
120
-
121
-
122
-
123
-
124
-
125
-
126
-
127
-
128
-
129
-
130
-
131
-
132
-
133
-
134
-
135
-
136
-
137
-
138
-
139
-
140
-
141
-
142
-
143
-
144
-
145
-
146
-
147
-
148
-
149
-
150
-
151
-
152
-
153
-
154
-
155
-
156
-
157
-
158
-
159
-
160
-
161
-
162
-
163
-
164
 |
 |

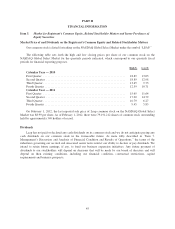
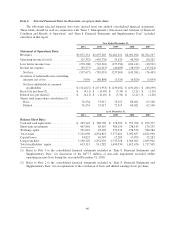
Item 6. Selected Financial Data (in thousands, except per share data)
The following selected financial data were derived from our audited consolidated financial statements.
These tables should be read in conjunction with “Item 7. Management’s Discussion and Analysis of Financial
Condition and Results of Operations” and “Item 8. Financial Statements and Supplementary Data” included
elsewhere in this report.
Year Ended December 31,
2011 2010 2009 2008 2007
Statement of Operations Data:
Revenues ............................ $3,071,131 $2,697,203 $2,481,321 $2,031,924 $1,702,167
Operating income (loss)(1) .............. (25,352) (450,738) 31,124 46,700 60,262
Loss before income taxes ............... (278,300) (742,542) (197,354) (104,411) (40,521)
Income tax expense .................... (39,377) (42,513) (40,609) (38,970) (35,924)
Net loss ........................... (317,677) (785,055) (237,963) (143,381) (76,445)
Accretion of redeemable non-controlling
interests, net of tax .................. 3,050 (86,898) (1,529) (6,820) (3,854)
Net loss attributable to common
stockholders ...................... $ (314,627) $ (871,953) $ (239,492) $ (150,201) $ (80,299)
Basic loss per share(2) .................. $ (4.11) $ (11.49) $ (3.30) $ (2.21) $ (1.20)
Diluted loss per share(2) ................ $ (4.11) $ (11.49) $ (3.30) $ (2.21) $ (1.20)
Shares used in per share calculations:(2)
Basic ............................. 76,534 75,917 72,515 68,021 67,100
Diluted ............................ 76,534 75,917 72,515 68,021 67,100
As of December 31,
2011 2010 2009 2008 2007
Balance Sheet Data:
Cash and cash equivalents ............... $ 345,243 $ 350,790 $ 174,999 $ 357,708 $ 433,337
Short-term investments ................. 405,801 68,367 389,154 238,143 179,233
Working capital ....................... 321,891 85,305 272,974 278,576 380,384
Total assets .......................... 5,152,690 4,834,823 5,377,481 5,052,857 4,432,998
Capital leases ......................... 34,823 10,307 12,285 13,993 53,283
Long-term debt ....................... 3,198,749 2,832,070 2,735,318 2,566,025 2,033,902
Total stockholders’ equity ............... 613,315 911,282 1,690,530 1,612,676 1,717,505
(1) Refer to Note 5 to the consolidated financial statements included in “Item 8. Financial Statements and
Supplementary Data” for discussion of the $477.3 million of non-cash impairment recorded within
operating income (loss) during the year ended December 31, 2010.
(2) Refer to Note 2 to the consolidated financial statements included in “Item 8. Financial Statements and
Supplementary Data” for an explanation of the calculation of basic and diluted earnings (loss) per share.
46