Cricket Wireless 2011 Annual Report Download - page 70
Download and view the complete annual report
Please find page 70 of the 2011 Cricket Wireless annual report below. You can navigate through the pages in the report by either clicking on the pages listed below, or by using the keyword search tool below to find specific information within the annual report.-
 1
1 -
2
-
3
-
4
-
5
-
6
-
7
-
8
-
9
-
10
-
11
-
12
-
13
-
14
-
15
-
16
-
17
-
18
-
19
-
20
-
21
-
22
-
23
-
24
-
25
-
26
-
27
-
28
-
29
-
30
-
31
-
32
-
33
-
34
-
35
-
36
-
37
-
38
-
39
-
40
-
41
-
42
-
43
-
44
-
45
-
46
-
47
-
48
-
49
-
50
-
51
-
52
-
53
-
54
-
55
-
56
-
57
-
58
-
59
-
 60
60 -
 61
61 -
 62
62 -
 63
63 -
 64
64 -
 65
65 -
 66
66 -
 67
67 -
 68
68 -
 69
69 -
 70
70 -
 71
71 -
 72
72 -
 73
73 -
 74
74 -
 75
75 -
 76
76 -
 77
77 -
 78
78 -
 79
79 -
 80
80 -
81
-
82
-
83
-
84
-
85
-
86
-
87
-
88
-
89
-
90
-
91
-
92
-
93
-
94
-
95
-
96
-
97
-
98
-
99
-
100
-
101
-
102
-
103
-
104
-
105
-
106
-
107
-
108
-
109
-
110
-
111
-
112
-
113
-
114
-
115
-
116
-
117
-
118
-
119
-
120
-
121
-
122
-
123
-
124
-
125
-
126
-
127
-
128
-
129
-
130
-
131
-
132
-
133
-
134
-
135
-
136
-
137
-
138
-
139
-
140
-
141
-
142
-
143
-
144
-
145
-
146
-
147
-
148
-
149
-
150
-
151
-
152
-
153
-
154
-
155
-
156
-
157
-
158
-
159
-
160
-
161
-
162
-
163
-
164
 |
 |
primarily due to an increase in customer churn of approximately 20 basis points, driven by increased competition
in the wireless telecommunications industry, partially offset by an increase in the number of new voice customers
as a result of customer acceptance of our “all-inclusive” service plans and smartphones that we introduced in the
second half of 2010.
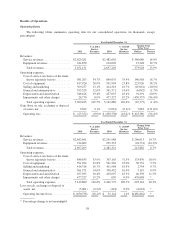
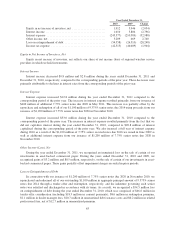
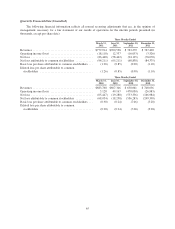
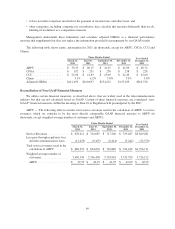
Service Revenues
Service revenues increased $346.7 million, or 14.0%, for the year ended December 31, 2011 compared to
the corresponding period of the prior year. This increase resulted from a 9.2% increase in the weighted-average
total number of customers due to customer growth in our existing markets and the contribution of approximately
323,000 customers by Pocket to STX Wireless in October 2010 in connection with the formation of our South
Texas joint venture, as well as a 7.8% increase in ARPU. The increase in ARPU was primarily attributable to
increased uptake of our higher-priced service plans for smartphones that we introduced in the second half of 2010
as well as the impact of our new Muve Music service, partially offset by a decrease in average total customers for
our Cricket Broadband service and the elimination of certain late payment and reactivation fees in the second
half of 2010.
Service revenues increased $240.6 million, or 10.7%, for the year ended December 31, 2010 compared to
the corresponding period of the prior year. This increase resulted from an 18.0% increase in the weighted-
average total number of customers, including approximately 323,000 customers that were contributed by Pocket
to STX Wireless in October 2010 in connection with the formation of our South Texas joint venture. This
increase was partially offset by a 6.2% decline in ARPU. The decline in ARPU was primarily attributable to the
impact of the addition of former Pocket customers on lower-priced, legacy Pocket service plans and the
elimination of certain late payment and reactivation fees in 2010, offset by customer adoption of our higher-
priced service plans.
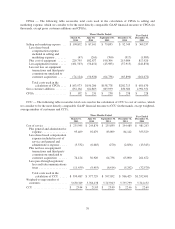
Equipment Revenues
Equipment revenues increased $27.2 million, or 12.7%, for the year ended December 31, 2011 compared to
the corresponding period of the prior year. This increase was primarily due to an 8.7% increase in the number of
devices sold to new and upgrading customers as well as a 3.7% increase in average revenue per device sold. The
increase in average revenue per device sold was primarily due to increased sales of our smartphones and Muve
Music enabled devices that were launched in the second half of 2010.
Equipment revenues decreased $24.7 million, or 10.3%, for the year ended December 31, 2010 compared to
the corresponding period of the prior year. A 10.2% increase in the number of devices sold was more than offset
by a reduction in average revenue per device sold. The reduction in average revenue per device sold was
primarily due to various device promotions offered to customers, a reduction in the average selling price of our
devices to new and upgrading customers in connection with our introduction of “all-inclusive” service plans in
2010, in which we eliminated the free first month of service and instead decreased the prices of our devices, and
an increase in commissions paid to dealers, which are recorded as a reduction of equipment revenue.
Cost of Service
Cost of service increased $140.6 million, or 16.7%, for the year ended December 31, 2011 compared to the
corresponding period of the prior year. As a percentage of service revenues, cost of service was 34.7% compared
to 33.9% in the corresponding period of the prior year. Principal factors contributing to the increase in cost of
service included increased telecommunications taxes due to both a 9.2% increase in the weighted-average total
number of customers and increases in federal and state tax rates, our increased penetration in existing markets
with higher tax rates and increased roaming costs in connection with the introduction of our unlimited nationwide
service plans.
60