Cricket Wireless 2011 Annual Report Download - page 76
Download and view the complete annual report
Please find page 76 of the 2011 Cricket Wireless annual report below. You can navigate through the pages in the report by either clicking on the pages listed below, or by using the keyword search tool below to find specific information within the annual report.-
 1
1 -
2
-
3
-
4
-
5
-
6
-
7
-
8
-
9
-
10
-
11
-
12
-
13
-
14
-
15
-
16
-
17
-
18
-
19
-
20
-
21
-
22
-
23
-
24
-
25
-
26
-
27
-
28
-
29
-
30
-
31
-
32
-
33
-
34
-
35
-
36
-
37
-
38
-
39
-
40
-
41
-
42
-
43
-
44
-
45
-
46
-
47
-
48
-
49
-
50
-
51
-
52
-
53
-
54
-
55
-
56
-
57
-
58
-
59
-
60
-
61
-
62
-
63
-
64
-
65
-
 66
66 -
 67
67 -
 68
68 -
 69
69 -
 70
70 -
 71
71 -
 72
72 -
 73
73 -
 74
74 -
 75
75 -
 76
76 -
 77
77 -
 78
78 -
 79
79 -
 80
80 -
 81
81 -
 82
82 -
 83
83 -
 84
84 -
 85
85 -
 86
86 -
87
-
88
-
89
-
90
-
91
-
92
-
93
-
94
-
95
-
96
-
97
-
98
-
99
-
100
-
101
-
102
-
103
-
104
-
105
-
106
-
107
-
108
-
109
-
110
-
111
-
112
-
113
-
114
-
115
-
116
-
117
-
118
-
119
-
120
-
121
-
122
-
123
-
124
-
125
-
126
-
127
-
128
-
129
-
130
-
131
-
132
-
133
-
134
-
135
-
136
-
137
-
138
-
139
-
140
-
141
-
142
-
143
-
144
-
145
-
146
-
147
-
148
-
149
-
150
-
151
-
152
-
153
-
154
-
155
-
156
-
157
-
158
-
159
-
160
-
161
-
162
-
163
-
164
 |
 |

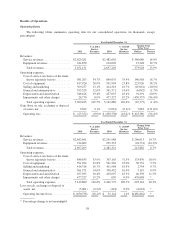
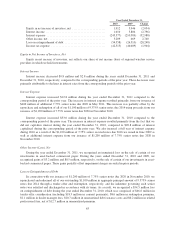
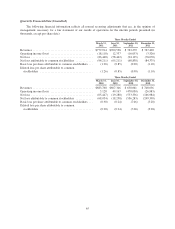
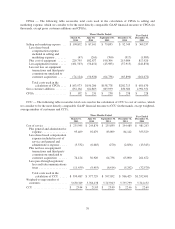
Quarterly Results of Operations Data (Unaudited)
The following table presents our unaudited condensed consolidated quarterly statement of operations data
for 2011, which has been derived from our unaudited condensed consolidated financial statements (in thousands):
Three Months Ended
March 31,
2011
June 30,
2011
September 30,
2011
December 31,
2011
Revenues:
Service revenues ................................. $678,411 $704,087 $717,296 $729,487
Equipment revenues .............................. 101,503 56,451 45,983 37,913
Total revenues ................................. 779,914 760,538 763,279 767,400
Operating expenses:
Cost of service (exclusive of items shown separately
below) ....................................... 235,945 244,870 255,899 244,489
Cost of equipment ................................ 229,795 182,677 190,364 215,084
Selling and marketing ............................. 109,852 87,161 79,895 92,349
General and administrative ......................... 95,409 92,079 83,899 84,142
Depreciation and amortization ...................... 126,674 136,137 144,904 140,711
Impairments and other charges ...................... — 631 23,693 2,446
Total operating expenses ......................... 797,675 743,555 778,654 779,221
Gain (loss) on sale, exchange or disposal of assets, net ..... (349) (4,646) (678) 8,295
Operating income (loss) ........................... (18,110) 12,337 (16,053) (3,526)
Equity in net income of investees, net .................. 1,179 1,010 764 31
Interest income .................................... 64 59 59 63
Interest expense .................................... (58,819) (61,923) (67,028) (68,405)
Other income (loss), net ............................. — (32) 32 (2)
Loss before income taxes .......................... (75,686) (48,549) (82,226) (71,839)
Income tax expense ................................. (10,754) (9,893) (11,899) (6,831)
Net loss ........................................ (86,440) (58,442) (94,125) (78,670)
Accretion of redeemable non-controlling interests, net of
tax ............................................ (9,771) (6,769) 25,295 (5,705)
Net loss attributable to common stockholders .......... $(96,211) $ (65,211) $ (68,830) $ (84,375)
Performance Measures
In managing our business and assessing our financial performance, management supplements the
information provided by financial statement measures with several customer-focused performance metrics that
are widely used in the telecommunications industry. These metrics include ARPU, which measures average
service revenue per customer; CPGA, which measures the average cost of acquiring a new customer; cash costs
per user per month, or CCU, which measures the non-selling cash cost of operating our business on a per
customer basis; churn, which measures turnover in our customer base; and adjusted OIBDA, which measures
operating performance. ARPU, CPGA, CCU and adjusted OIBDA are non-GAAP financial measures. A
non-GAAP financial measure, within the meaning of Item 10 of Regulation S-K promulgated by the SEC, is a
numerical measure of a company’s financial performance or cash flows that (a) excludes amounts, or is subject to
adjustments that have the effect of excluding amounts, which are included in the most directly comparable
measure calculated and presented in accordance with generally accepted accounting principles in the
consolidated balance sheets, consolidated statements of operations or consolidated statements of cash flows; or
(b) includes amounts, or is subject to adjustments that have the effect of including amounts, which are excluded
66