Cricket Wireless 2011 Annual Report Download - page 72
Download and view the complete annual report
Please find page 72 of the 2011 Cricket Wireless annual report below. You can navigate through the pages in the report by either clicking on the pages listed below, or by using the keyword search tool below to find specific information within the annual report.-
 1
1 -
2
-
3
-
4
-
5
-
6
-
7
-
8
-
9
-
10
-
11
-
12
-
13
-
14
-
15
-
16
-
17
-
18
-
19
-
20
-
21
-
22
-
23
-
24
-
25
-
26
-
27
-
28
-
29
-
30
-
31
-
32
-
33
-
34
-
35
-
36
-
37
-
38
-
39
-
40
-
41
-
42
-
43
-
44
-
45
-
46
-
47
-
48
-
49
-
50
-
51
-
52
-
53
-
54
-
55
-
56
-
57
-
58
-
59
-
60
-
61
-
 62
62 -
 63
63 -
 64
64 -
 65
65 -
 66
66 -
 67
67 -
 68
68 -
 69
69 -
 70
70 -
 71
71 -
 72
72 -
 73
73 -
 74
74 -
 75
75 -
 76
76 -
 77
77 -
 78
78 -
 79
79 -
 80
80 -
 81
81 -
 82
82 -
83
-
84
-
85
-
86
-
87
-
88
-
89
-
90
-
91
-
92
-
93
-
94
-
95
-
96
-
97
-
98
-
99
-
100
-
101
-
102
-
103
-
104
-
105
-
106
-
107
-
108
-
109
-
110
-
111
-
112
-
113
-
114
-
115
-
116
-
117
-
118
-
119
-
120
-
121
-
122
-
123
-
124
-
125
-
126
-
127
-
128
-
129
-
130
-
131
-
132
-
133
-
134
-
135
-
136
-
137
-
138
-
139
-
140
-
141
-
142
-
143
-
144
-
145
-
146
-
147
-
148
-
149
-
150
-
151
-
152
-
153
-
154
-
155
-
156
-
157
-
158
-
159
-
160
-
161
-
162
-
163
-
164
 |
 |

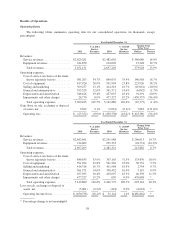
Depreciation and Amortization
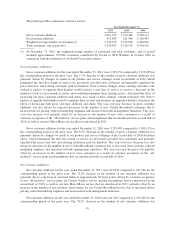
Depreciation and amortization expense increased $91.4 million, or 20.0%, for the year ended
December 31, 2011 compared to the corresponding period of the prior year. The increase in depreciation and
amortization expense was due primarily to the expansion and upgrade of our network and corporate platforms as
well as depreciation and amortization expense related to the assets that Pocket contributed to STX Wireless in
connection with the formation of our South Texas joint venture in October 2010.
Depreciation and amortization expense increased $46.3 million, or 11.3%, for the year ended
December 31, 2010 compared to the corresponding period of the prior year. The increase in depreciation and
amortization expense was due primarily to an increase in property and equipment in connection with the
expansion and upgrade of our networks in existing markets.
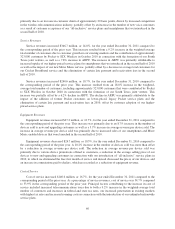
Impairments and Other Charges
During the year ended December 31, 2011, we incurred approximately $26.4 million of integration charges
relating primarily to certain leased cell site and retail store locations contributed to our joint venture STX
Wireless in the South Texas region that it no longer uses. As a result of our annual impairment testing of our
goodwill conducted during the third quarter of 2011, no goodwill impairment charges were identified or
recorded. As a result of our annual impairment testing of our goodwill conducted during the third quarter of
2010, we recorded a goodwill impairment charge of $430.1 million, which is more fully described in Note 5 to
our consolidated financial statements, included in “Part II—Item 8. Financial Statements and Supplementary
Data” in this report. In addition, as a result of our determination to spend an increased portion of our planned
capital expenditures on the deployment of next-generation LTE technology and to defer our previously planned
network expansion activities, we also recorded an impairment charge of $46.5 million during the year ended
December 31, 2010. These costs were previously included in construction-in-progress, for certain network
design, site acquisition and interest costs capitalized during the construction period. No such impairment charges
were recorded during the year ended December 31, 2009.
As a result of our annual impairment testing of our wireless licenses conducted during the third quarters of
2011, 2010 and 2009, we recorded impairment charges of $0.4 million, $0.8 million and $0.6 million,
respectively, to reduce the carrying value of certain non-operating wireless licenses to their fair value. No such
impairment charges were recorded with respect to our operating wireless licenses for either period, as the
aggregate fair values of these licenses exceeded their aggregate carrying value.
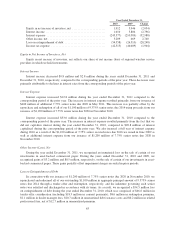
Gain (Loss) on Sale, Exchange or Disposal of Assets, Net
Gain (loss) on sale, exchange or disposal of assets, net reflects the net gain or loss recognized upon the
disposal of certain of our property and equipment and wireless licenses. We recognized a net gain of $2.6 million
and net losses of $5.1 million and $0.4 million during the years ended December 31, 2011, 2010 and 2009,
respectively. During the year ended December 31, 2011, we recognized a non-cash gain on the exchange of
wireless licenses of $20.5 million. Offsetting this gain were losses recognized on the disposal of certain of our
property and equipment during the year.
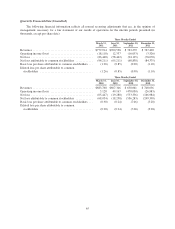
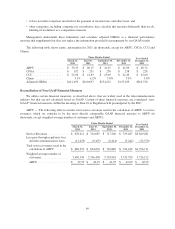
Non-Operating Items
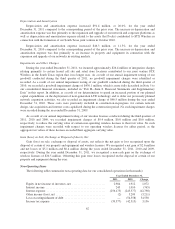
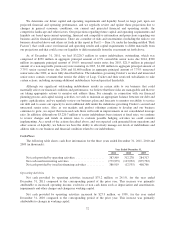
The following tables summarize non-operating data for our consolidated operations (in thousands):
Year Ended December 31,
2011 2010 Change
Equity in net income of investees, net ....................... 2,984 1,912 1,072
Interest income ......................................... 245 1,010 (765)
Interest expense ........................................ (256,175) (243,377) (12,798)
Other income (loss), net .................................. (2) 3,209 (3,211)
Loss on extinguishment of debt ............................ — (54,558) 54,558
Income tax expense ..................................... (39,377) (42,513) 3,136
62