Cricket Wireless 2011 Annual Report Download - page 71
Download and view the complete annual report
Please find page 71 of the 2011 Cricket Wireless annual report below. You can navigate through the pages in the report by either clicking on the pages listed below, or by using the keyword search tool below to find specific information within the annual report.-
 1
1 -
2
-
3
-
4
-
5
-
6
-
7
-
8
-
9
-
10
-
11
-
12
-
13
-
14
-
15
-
16
-
17
-
18
-
19
-
20
-
21
-
22
-
23
-
24
-
25
-
26
-
27
-
28
-
29
-
30
-
31
-
32
-
33
-
34
-
35
-
36
-
37
-
38
-
39
-
40
-
41
-
42
-
43
-
44
-
45
-
46
-
47
-
48
-
49
-
50
-
51
-
52
-
53
-
54
-
55
-
56
-
57
-
58
-
59
-
60
-
 61
61 -
 62
62 -
 63
63 -
 64
64 -
 65
65 -
 66
66 -
 67
67 -
 68
68 -
 69
69 -
 70
70 -
 71
71 -
 72
72 -
 73
73 -
 74
74 -
 75
75 -
 76
76 -
 77
77 -
 78
78 -
 79
79 -
 80
80 -
 81
81 -
82
-
83
-
84
-
85
-
86
-
87
-
88
-
89
-
90
-
91
-
92
-
93
-
94
-
95
-
96
-
97
-
98
-
99
-
100
-
101
-
102
-
103
-
104
-
105
-
106
-
107
-
108
-
109
-
110
-
111
-
112
-
113
-
114
-
115
-
116
-
117
-
118
-
119
-
120
-
121
-
122
-
123
-
124
-
125
-
126
-
127
-
128
-
129
-
130
-
131
-
132
-
133
-
134
-
135
-
136
-
137
-
138
-
139
-
140
-
141
-
142
-
143
-
144
-
145
-
146
-
147
-
148
-
149
-
150
-
151
-
152
-
153
-
154
-
155
-
156
-
157
-
158
-
159
-
160
-
161
-
162
-
163
-
164
 |
 |
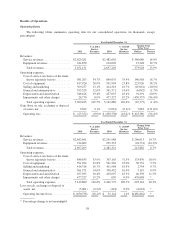
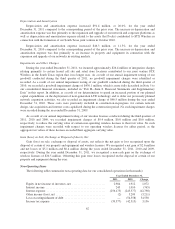
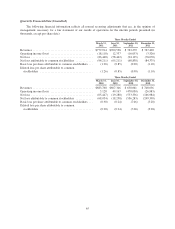
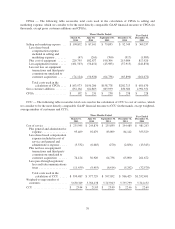
Cost of service increased $133.5 million, or 18.9%, for the year ended December 31, 2010 compared to the
corresponding period of the prior year. As a percentage of service revenues, cost of service was 33.9% compared
to 31.5% in the corresponding period of the prior year. Principal factors contributing to the increase in cost of
service included increases in roaming and international long distance costs in connection with our introduction of
unlimited nationwide roaming and international long distance services, increases in telecommunications taxes
due to increases in federal and state tax rates and our expansion into markets with higher tax rates, and increases
in our fixed network costs associated with a full year of operations in markets launched in 2009.
Cost of Equipment
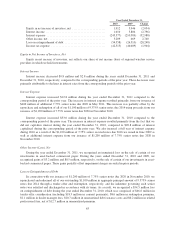
Cost of equipment increased $225.9 million, or 38.2%, for the year ended December 31, 2011 compared to
the corresponding period of the prior year. A 27.2% increase in the average cost per device sold was
accompanied by a 8.7% increase in the number of devices sold. The increase in the average cost per device sold
to new and upgrading customers during the period was largely attributable to our introduction of smartphones in
2010, as well as customer acceptance of our new Muve Music enabled devices in 2011.
Cost of equipment increased $30.7 million, or 5.5%, for the year ended December 31, 2010 compared to the
corresponding period of the prior year. A 10.2% increase in the number of devices sold was offset by a reduction
in the average cost per device sold, primarily due to benefits of scale and our cost-management initiatives.
Selling and Marketing Expenses
Selling and marketing expenses decreased $45.1 million, or 10.9%, for the year ended December 31, 2011
compared to the corresponding period of the prior year. As a percentage of service revenues, such expenses
decreased to 13.1% from 16.7% in the corresponding period of the prior year. This percentage decrease was
largely attributable to a 1.5% decrease in media and advertising costs as a percentage of service revenues,
reflecting higher spending in the corresponding period of the prior year in connection with the launch of our new
“all-inclusive” service plans and smartphones, as well as an increase in service revenues and consequent benefits
of scale.
Selling and marketing expenses increased $2.8 million, or 0.7%, for the year ended December 31, 2010
compared to the corresponding period of the prior year. As a percentage of service revenues, such expenses
decreased to 16.7% from 18.4% in the corresponding period of the prior year. This percentage decrease was
largely attributable to a 0.8% decrease in media and advertising costs as a percentage of service revenues,
reflecting higher spending in the prior year period in connection with the launch of our two largest markets in
2009, and increases in service revenues and consequent benefits of scale, slightly offset by increased advertising
costs related to our business initiatives launched in the second half of 2010.
General and Administrative Expenses
General and administrative expenses decreased $6.0 million, or 1.7%, for the year ended
December 31, 2011 compared to the corresponding period of the prior year. As a percentage of service revenues,
such expenses decreased to 12.6% from 14.6% in the corresponding period of the prior year primarily due to
continued benefits from our cost-management initiatives and the increase in service revenues and consequent
benefits of scale.
General and administrative expenses increased $3.1 million, or 0.9%, for the year ended December 31, 2010
compared to the corresponding period of the prior year. As a percentage of service revenues, such expenses
decreased to 14.6% from 16.0% in the corresponding period of the prior year primarily due to the increase in
service revenues and consequent benefits of scale and continued benefits realized from our cost-management
initiatives.
61