Cricket Wireless 2011 Annual Report Download - page 114
Download and view the complete annual report
Please find page 114 of the 2011 Cricket Wireless annual report below. You can navigate through the pages in the report by either clicking on the pages listed below, or by using the keyword search tool below to find specific information within the annual report.-
 1
1 -
2
-
3
-
4
-
5
-
6
-
7
-
8
-
9
-
10
-
11
-
12
-
13
-
14
-
15
-
16
-
17
-
18
-
19
-
20
-
21
-
22
-
23
-
24
-
25
-
26
-
27
-
28
-
29
-
30
-
31
-
32
-
33
-
34
-
35
-
36
-
37
-
38
-
39
-
40
-
41
-
42
-
43
-
44
-
45
-
46
-
47
-
48
-
49
-
50
-
51
-
52
-
53
-
54
-
55
-
56
-
57
-
58
-
59
-
60
-
61
-
62
-
63
-
64
-
65
-
66
-
67
-
68
-
69
-
70
-
71
-
72
-
73
-
74
-
75
-
76
-
77
-
78
-
79
-
80
-
81
-
82
-
83
-
84
-
85
-
86
-
87
-
88
-
89
-
90
-
91
-
92
-
93
-
94
-
95
-
96
-
97
-
98
-
99
-
100
-
101
-
102
-
103
-
 104
104 -
 105
105 -
 106
106 -
 107
107 -
 108
108 -
 109
109 -
 110
110 -
 111
111 -
 112
112 -
 113
113 -
 114
114 -
 115
115 -
 116
116 -
 117
117 -
 118
118 -
 119
119 -
 120
120 -
 121
121 -
 122
122 -
 123
123 -
 124
124 -
125
-
126
-
127
-
128
-
129
-
130
-
131
-
132
-
133
-
134
-
135
-
136
-
137
-
138
-
139
-
140
-
141
-
142
-
143
-
144
-
145
-
146
-
147
-
148
-
149
-
150
-
151
-
152
-
153
-
154
-
155
-
156
-
157
-
158
-
159
-
160
-
161
-
162
-
163
-
164
 |
 |

LEAP WIRELESS INTERNATIONAL, INC.
NOTES TO CONSOLIDATED FINANCIAL STATEMENTS — (Continued)
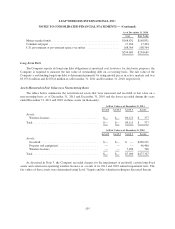
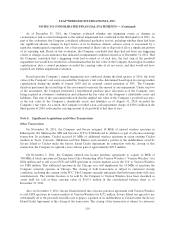
At Fair Value as of December 31, 2010
Level 1 Level 2 Level 3 Total
Assets:
Money market funds ........................... $— $168,831 $— $168,831
Commercial paper ............................. — 17,494 — 17,494
U.S. government or government agency securities .... — 108,364 — 108,364
Total .......................................... $— $294,689 $— $294,689
Assets in the tables above are reported on the consolidated balance sheets as components of cash and cash
equivalents, short-term investments, other current assets and other assets.
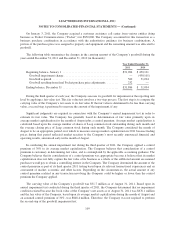
The following table provides a summary of the changes in the fair value of the Company’s Level 3 financial
assets (in thousands).
Year Ended
December 31,
2011 2010
Beginning balance, January 1 .......................................... $ — $2,731
Total gains (losses):
Included in net loss ................................................ $ — $3,341
Included in comprehensive income (loss) .............................. — (1,680)
Purchases and (sales):
Sales ........................................................... — (4,392)
Transfers in (out) of Level 3 ......................................... — —
Ending balance, December 31, ......................................... $ — $ —
Unrealized gains (losses) are presented in accumulated other comprehensive loss within stockholders’
equity in the consolidated balance sheets. Realized gains (losses) are presented in other income (expense), net in
the consolidated statements of operations.
Cash Equivalents and Short-Term Investments
As of December 31, 2011 and December 31, 2010, all of the Company’s short-term investments were debt
securities with contractual maturities of less than one year and were classified as available-for-sale. The fair
value of the Company’s cash equivalents, short-term investments in obligations of the U.S. government and
government agencies and its short-term investments in commercial paper is determined using observable market-
based inputs for similar assets, which primarily include yield curves and time-to-maturity factors. Such
investments are therefore considered to be Level 2 items.
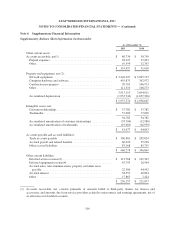
Available-for-sale securities were comprised as follows as of December 31, 2011 and December 31, 2010
(in thousands):
As of December 31, 2011
Cost Fair Value
Money market funds ............................................. $224,383 $224,383
Commercial paper ............................................... 165,201 165,202
U.S. government or government agency securities ...................... 293,626 293,610
$683,210 $683,195
104