Cricket Wireless 2011 Annual Report Download - page 101
Download and view the complete annual report
Please find page 101 of the 2011 Cricket Wireless annual report below. You can navigate through the pages in the report by either clicking on the pages listed below, or by using the keyword search tool below to find specific information within the annual report.-
 1
1 -
2
-
3
-
4
-
5
-
6
-
7
-
8
-
9
-
10
-
11
-
12
-
13
-
14
-
15
-
16
-
17
-
18
-
19
-
20
-
21
-
22
-
23
-
24
-
25
-
26
-
27
-
28
-
29
-
30
-
31
-
32
-
33
-
34
-
35
-
36
-
37
-
38
-
39
-
40
-
41
-
42
-
43
-
44
-
45
-
46
-
47
-
48
-
49
-
50
-
51
-
52
-
53
-
54
-
55
-
56
-
57
-
58
-
59
-
60
-
61
-
62
-
63
-
64
-
65
-
66
-
67
-
68
-
69
-
70
-
71
-
72
-
73
-
74
-
75
-
76
-
77
-
78
-
79
-
80
-
81
-
82
-
83
-
84
-
85
-
86
-
87
-
88
-
89
-
90
-
 91
91 -
 92
92 -
 93
93 -
 94
94 -
 95
95 -
 96
96 -
 97
97 -
 98
98 -
 99
99 -
 100
100 -
 101
101 -
 102
102 -
 103
103 -
 104
104 -
 105
105 -
 106
106 -
 107
107 -
 108
108 -
 109
109 -
 110
110 -
 111
111 -
112
-
113
-
114
-
115
-
116
-
117
-
118
-
119
-
120
-
121
-
122
-
123
-
124
-
125
-
126
-
127
-
128
-
129
-
130
-
131
-
132
-
133
-
134
-
135
-
136
-
137
-
138
-
139
-
140
-
141
-
142
-
143
-
144
-
145
-
146
-
147
-
148
-
149
-
150
-
151
-
152
-
153
-
154
-
155
-
156
-
157
-
158
-
159
-
160
-
161
-
162
-
163
-
164
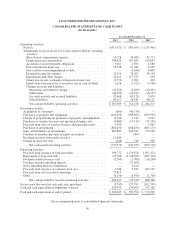
 |
 |

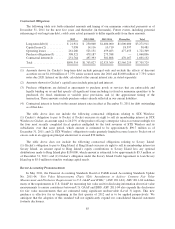
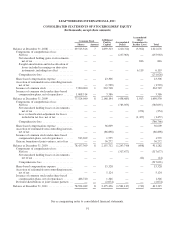
LEAP WIRELESS INTERNATIONAL, INC.
CONSOLIDATED STATEMENTS OF STOCKHOLDERS’ EQUITY
(In thousands, except share amounts)
Common Stock Additional
Paid-In
Capital
Accumulated
Deficit
Accumulated
Other
Comprehensive
Income (Loss) TotalShares Amount
Balance at December 31, 2008 .................. 69,515,526 7 1,839,313 (220,722) (5,922) 1,612,676
Components of comprehensive loss:
Net loss ................................ — — — (237,963) — (237,963)
Net unrealized holding gains on investments,
netoftax ............................. — — — — 816 816
Swaplet amortization and reclassification of
losses included in earnings on derivative
instruments, including tax effect .......... — — — — 6,119 6,119
Comprehensive loss ...................... (231,028)
Share-based compensation expense ............ — — 43,306 — — 43,306
Accretion of redeemable non-controlling interests,
netoftax ............................... — — (1,529) — — (1,529)
Issuance of common stock ................... 7,000,000 1 263,718 — — 263,719
Issuance of common stock under share-based
compensation plans, net of repurchases ....... 1,008,514 — 3,386 — — 3,386
Balance at December 31, 2009 .................. 77,524,040 8 2,148,194 (458,685) 1,013 1,690,530
Components of comprehensive loss:
Net loss ................................ — — — (785,055) — (785,055)
Net unrealized holding losses on investments,
netoftax ............................. — — — — (254) (254)
Less: reclassification adjustment for losses
included in net loss, net of tax ............ — — — — (1,457) (1,457)
Comprehensive loss ...................... (786,766)
Share-based compensation expense ............ — — 36,609 — — 36,609
Accretion of redeemable non-controlling interests,
netoftax ............................... — — (86,898) — — (86,898)
Issuance of common stock under share-based
compensation plans, net of repurchases ....... 913,269 — 1,535 — — 1,535
Gain on formation of joint ventures, net of tax . . . — — 56,272 — — 56,272
Balance at December 31, 2010 .................. 78,437,309 8 2,155,712 (1,243,740) (698) 911,282
Components of comprehensive loss:
Net loss ................................ — — — (317,677) — (317,677)
Net unrealized holding losses on investments,
netoftax ............................. — — — — (14) (14)
Comprehensive loss ...................... (317,691)
Share-based compensation expense ............ — — 15,328 — — 15,328
Accretion of redeemable non-controlling interests,
netoftax ............................... — — 5,124 — — 5,124
Issuance of common stock under share-based
compensation plans, net of repurchases ....... 486,740 — 1,346 — — 1,346
Preferred distributions to joint venture partners . . . — — (2,074) — — (2,074)
Balance at December 31, 2011 .................. 78,924,049 8 2,175,436 (1,561,417) (712) 613,315
See accompanying notes to consolidated financial statements.
91