Cricket Wireless 2011 Annual Report Download - page 82
Download and view the complete annual report
Please find page 82 of the 2011 Cricket Wireless annual report below. You can navigate through the pages in the report by either clicking on the pages listed below, or by using the keyword search tool below to find specific information within the annual report.-
 1
1 -
2
-
3
-
4
-
5
-
6
-
7
-
8
-
9
-
10
-
11
-
12
-
13
-
14
-
15
-
16
-
17
-
18
-
19
-
20
-
21
-
22
-
23
-
24
-
25
-
26
-
27
-
28
-
29
-
30
-
31
-
32
-
33
-
34
-
35
-
36
-
37
-
38
-
39
-
40
-
41
-
42
-
43
-
44
-
45
-
46
-
47
-
48
-
49
-
50
-
51
-
52
-
53
-
54
-
55
-
56
-
57
-
58
-
59
-
60
-
61
-
62
-
63
-
64
-
65
-
66
-
67
-
68
-
69
-
70
-
71
-
 72
72 -
 73
73 -
 74
74 -
 75
75 -
 76
76 -
 77
77 -
 78
78 -
 79
79 -
 80
80 -
 81
81 -
 82
82 -
 83
83 -
 84
84 -
 85
85 -
 86
86 -
 87
87 -
 88
88 -
 89
89 -
 90
90 -
 91
91 -
 92
92 -
93
-
94
-
95
-
96
-
97
-
98
-
99
-
100
-
101
-
102
-
103
-
104
-
105
-
106
-
107
-
108
-
109
-
110
-
111
-
112
-
113
-
114
-
115
-
116
-
117
-
118
-
119
-
120
-
121
-
122
-
123
-
124
-
125
-
126
-
127
-
128
-
129
-
130
-
131
-
132
-
133
-
134
-
135
-
136
-
137
-
138
-
139
-
140
-
141
-
142
-
143
-
144
-
145
-
146
-
147
-
148
-
149
-
150
-
151
-
152
-
153
-
154
-
155
-
156
-
157
-
158
-
159
-
160
-
161
-
162
-
163
-
164
 |
 |

We determine our future capital and operating requirements and liquidity based, in large part, upon our
projected financial and operating performance, and we regularly review and update these projections due to
changes in general economic conditions, our current and projected financial and operating results, the
competitive landscape and other factors. Our projections regarding future capital and operating requirements and
liquidity are based upon current operating, financial and competitive information and projections regarding our
business and its financial performance. There are a number of risks and uncertainties (including the risks to our
business described above and others set forth in this report in Part I — Item 1A. under the heading entitled “Risk
Factors”) that could cause our financial and operating results and capital requirements to differ materially from
our projections and that could cause our liquidity to differ materially from the assessment set forth above.
As of December 31, 2011, we had $3,220.7 million in senior indebtedness outstanding, which was
comprised of $250 million in aggregate principal amount of 4.5% convertible senior notes due 2014, $300
million in aggregate principal amount of 10.0% unsecured senior notes due 2015, $21.9 million in principal
amount of a non-negotiable promissory note maturing in 2015, $1,100 million in aggregate principal amount of
7.75% senior secured notes due 2016 and $1,600 million in aggregate principal amount of 7.75% unsecured
senior notes due 2020, as more fully described below. The indentures governing Cricket’s secured and unsecured
senior notes contain covenants that restrict the ability of Leap, Cricket and their restricted subsidiaries to take
certain actions, including incurring additional indebtedness beyond specified thresholds.
Although our significant outstanding indebtedness results in certain risks to our business that could
materially affect our financial condition and performance, we believe that these risks are manageable and that we
are taking appropriate actions to monitor and address them. For example, in connection with our financial
planning process and capital raising activities, we seek to maintain an appropriate balance between our debt and
equity capitalization, and we regularly review our business plans and forecasts to monitor our ability to service
our debt and to assess our capacity to incur additional debt under the indentures governing Cricket’s secured and
unsecured senior notes. Also, as our markets and product offerings continue to develop and our business
continues to grow, we expect that increased cash flows will result in improvements in our consolidated leverage
ratio. In addition, although our $3,220.7 million of senior indebtedness bears interest at fixed rates, we continue
to review changes and trends in interest rates to evaluate possible hedging activities we could consider
implementing. As a result of the actions described above, and our expected cash generated from operations and
other sources of liquidity, we believe we have the ability to effectively manage our levels of indebtedness and
address risks to our business and financial condition related to our indebtedness.
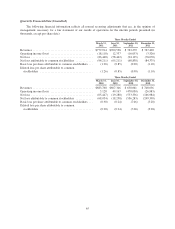
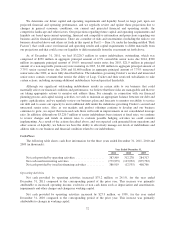
Cash Flows
The following table shows cash flow information for the three years ended December 31, 2011, 2010 and
2009 (in thousands):
Year Ended December 31,
2011 2010 2009
Net cash provided by operating activities ................... 387,509 312,278 284,317
Net cash used in investing activities ....................... (779,975) (123,952) (875,792)
Net cash provided by (used in) financing activities ............ 386,919 (12,535) 408,766
Operating Activities
Net cash provided by operating activities increased $75.2 million, or 24.1%, for the year ended
December 31, 2011 compared to the corresponding period of the prior year. This increase was primarily
attributable to increased operating income, exclusive of non cash items such as depreciation and amortization,
impairments and other charges and changes in working capital.
Net cash provided by operating activities increased by $27.9 million, or 9.8%, for the year ended
December 31, 2010 compared to the corresponding period of the prior year. This increase was primarily
attributable to changes in working capital.
72