Cricket Wireless 2011 Annual Report Download - page 113
Download and view the complete annual report
Please find page 113 of the 2011 Cricket Wireless annual report below. You can navigate through the pages in the report by either clicking on the pages listed below, or by using the keyword search tool below to find specific information within the annual report.-
 1
1 -
2
-
3
-
4
-
5
-
6
-
7
-
8
-
9
-
10
-
11
-
12
-
13
-
14
-
15
-
16
-
17
-
18
-
19
-
20
-
21
-
22
-
23
-
24
-
25
-
26
-
27
-
28
-
29
-
30
-
31
-
32
-
33
-
34
-
35
-
36
-
37
-
38
-
39
-
40
-
41
-
42
-
43
-
44
-
45
-
46
-
47
-
48
-
49
-
50
-
51
-
52
-
53
-
54
-
55
-
56
-
57
-
58
-
59
-
60
-
61
-
62
-
63
-
64
-
65
-
66
-
67
-
68
-
69
-
70
-
71
-
72
-
73
-
74
-
75
-
76
-
77
-
78
-
79
-
80
-
81
-
82
-
83
-
84
-
85
-
86
-
87
-
88
-
89
-
90
-
91
-
92
-
93
-
94
-
95
-
96
-
97
-
98
-
99
-
100
-
101
-
102
-
 103
103 -
 104
104 -
 105
105 -
 106
106 -
 107
107 -
 108
108 -
 109
109 -
 110
110 -
 111
111 -
 112
112 -
 113
113 -
 114
114 -
 115
115 -
 116
116 -
 117
117 -
 118
118 -
 119
119 -
 120
120 -
 121
121 -
 122
122 -
 123
123 -
124
-
125
-
126
-
127
-
128
-
129
-
130
-
131
-
132
-
133
-
134
-
135
-
136
-
137
-
138
-
139
-
140
-
141
-
142
-
143
-
144
-
145
-
146
-
147
-
148
-
149
-
150
-
151
-
152
-
153
-
154
-
155
-
156
-
157
-
158
-
159
-
160
-
161
-
162
-
163
-
164
 |
 |

LEAP WIRELESS INTERNATIONAL, INC.
NOTES TO CONSOLIDATED FINANCIAL STATEMENTS — (Continued)
quoted prices or for which fair value can be measured from actively quoted prices in active markets generally
have more pricing observability and require less judgment in measuring fair value. Conversely, assets and
liabilities that are rarely traded or not quoted have less pricing observability and are generally measured at fair
value using valuation models that require more judgment. These valuation techniques involve some level of
management estimation and judgment, the degree of which is dependent on the price transparency of the asset,
liability or market and the nature of the asset or liability.
The Company has categorized its assets and liabilities measured at fair value into a three-level hierarchy in
accordance with the authoritative guidance for fair value measurements. Assets and liabilities measured at fair
value using quoted prices in active markets for identical assets or liabilities are generally categorized as Level 1;
assets and liabilities measured at fair value using observable market-based inputs or unobservable inputs that are
corroborated by market data for similar assets or liabilities are generally categorized as Level 2; and assets and
liabilities measured at fair value using unobservable inputs that cannot be corroborated by market data are
generally categorized as Level 3. Assets and liabilities presented at fair value in the Company’s consolidated
balance sheets are generally categorized as follows:
Level 1: Quoted prices in active markets for identical assets or liabilities. The Company did not have any Level 1
assets or liabilities as of December 31, 2011 or December 31, 2010.
Level 2: Observable inputs other than Level 1 prices, such as quoted prices for similar assets or liabilities, quoted
prices in markets that are not active or other inputs that are observable or can be corroborated by
observable market data for substantially the full term of the assets or liabilities. The Company’s Level 2
assets as of December 31, 2011 and December 31, 2010 included its cash equivalents, its short-term
investments in obligations of the U.S. government and government agencies and its short-term
investments in commercial paper.
Level 3: Unobservable inputs that are supported by little or no market activity and that are significant to the fair
value of the assets or liabilities. Such assets and liabilities may have values determined using pricing
models, discounted cash flow methodologies, or similar techniques, and include instruments for which
the determination of fair value requires significant management judgment or estimation. The Company
did not have any Level 3 assets or liabilities as of December 31, 2011 or December 31, 2010, other than
the non-financial assets measured at fair value on a nonrecurring basis discussed below.
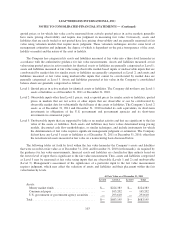
The following tables set forth by level within the fair value hierarchy the Company’s assets and liabilities
that were recorded at fair value as of December 31, 2011 and December 31, 2010 (in thousands). As required by
the guidance for fair value measurements, financial assets and liabilities are classified in their entirety based on
the lowest level of input that is significant to the fair value measurement. Thus, assets and liabilities categorized
as Level 3 may be measured at fair value using inputs that are observable (Levels 1 and 2) and unobservable
(Level 3). Management’s assessment of the significance of a particular input to the fair value measurement
requires judgment, which may affect the valuation of assets and liabilities and their placement within the fair
value hierarchy levels.
At Fair Value as of December 31, 2011
Level 1 Level 2 Level 3 Total
Assets:
Money market funds ........................... $— $224,383 $— $224,383
Commercial paper ............................. — 165,202 — 165,202
U.S. government or government agency securities .... — 293,610 — 293,610
Total .......................................... $— $683,195 $— $683,195
103