Cricket Wireless 2011 Annual Report Download - page 90
Download and view the complete annual report
Please find page 90 of the 2011 Cricket Wireless annual report below. You can navigate through the pages in the report by either clicking on the pages listed below, or by using the keyword search tool below to find specific information within the annual report.-
 1
1 -
2
-
3
-
4
-
5
-
6
-
7
-
8
-
9
-
10
-
11
-
12
-
13
-
14
-
15
-
16
-
17
-
18
-
19
-
20
-
21
-
22
-
23
-
24
-
25
-
26
-
27
-
28
-
29
-
30
-
31
-
32
-
33
-
34
-
35
-
36
-
37
-
38
-
39
-
40
-
41
-
42
-
43
-
44
-
45
-
46
-
47
-
48
-
49
-
50
-
51
-
52
-
53
-
54
-
55
-
56
-
57
-
58
-
59
-
60
-
61
-
62
-
63
-
64
-
65
-
66
-
67
-
68
-
69
-
70
-
71
-
72
-
73
-
74
-
75
-
76
-
77
-
78
-
79
-
 80
80 -
 81
81 -
 82
82 -
 83
83 -
 84
84 -
 85
85 -
 86
86 -
 87
87 -
 88
88 -
 89
89 -
 90
90 -
 91
91 -
 92
92 -
 93
93 -
 94
94 -
 95
95 -
 96
96 -
 97
97 -
 98
98 -
 99
99 -
 100
100 -
101
-
102
-
103
-
104
-
105
-
106
-
107
-
108
-
109
-
110
-
111
-
112
-
113
-
114
-
115
-
116
-
117
-
118
-
119
-
120
-
121
-
122
-
123
-
124
-
125
-
126
-
127
-
128
-
129
-
130
-
131
-
132
-
133
-
134
-
135
-
136
-
137
-
138
-
139
-
140
-
141
-
142
-
143
-
144
-
145
-
146
-
147
-
148
-
149
-
150
-
151
-
152
-
153
-
154
-
155
-
156
-
157
-
158
-
159
-
160
-
161
-
162
-
163
-
164
 |
 |
However, as more fully described in Note 4 to our consolidated financial statements included in “Item 8.
Financial Statements and Supplementary Data” of this report, we have non-financial assets measured at fair value
using Level 3 inputs on a non-recurring basis.
Generally, our results of operations are not significantly impacted by our assets and liabilities accounted for
at fair value due to the nature of each asset and liability.
We continue to report our long-term debt obligations at amortized cost and disclose the fair value of such
obligations.
Capital Expenditures, Significant Acquisitions and Other Transactions
Capital Expenditures
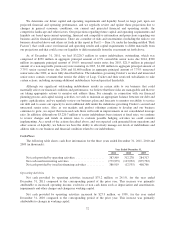
During the year ended December 31, 2011, we incurred approximately $441.7 million of capital
expenditures. These capital expenditures were primarily for the ongoing maintenance and development of our
network and other business assets and the initial deployment of next-generation LTE network technology. During
the year ended December 31, 2010, we incurred approximately $398.9 million of capital expenditures. These
capital expenditures were primarily for the ongoing growth and development of markets in commercial
operations and other internal capital projects.
Total capital expenditures for 2012 are expected to be between $600 million and $650 million. These capital
expenditures are primarily expected to support our initial deployment of LTE network technology, the ongoing
maintenance and development of our network and other business assets and other capital projects.
We currently target annual capital expenditures to support the ongoing maintenance and development of our
network and other business assets in the mid-teens as a percentage of our annual service revenues generated in
our current network footprint, and we currently expect to continue capital expenditures in a similar range over the
next several years. The actual amount of capital expenditures we spend in future years for these purposes may
vary as a result of numerous factors, including our then-available capital resources and customer usage of our
network resources.
As previously noted, we currently plan to deploy next-generation LTE network technology across
approximately two-thirds of our current network footprint over the next two to three years. We successfully
launched a commercial trial market in late 2011 and plan to cover up to approximately 25 million POPs with
LTE in 2012. Capital expenditures for the deployment of LTE are currently anticipated to be less than $10 per
covered POP. Approximately half of the estimated capital expenditures for LTE deployment are included in our
capital expense budget for the ongoing maintenance and development of our network and other business assets.
The actual amount we spend to deploy LTE each year will depend upon multiple factors, including the scope and
pace of our deployment activities.
Other Transactions
On November 30, 2011, we and Savary Island assigned 10 MHz of unused wireless spectrum in
Indianapolis, IN, Minneapolis, MN and Syracuse, NY to T-Mobile and its affiliates as part of a license exchange
transaction. In exchange, Cricket received 10 MHz of additional wireless spectrum in seven existing Cricket
markets in Texas, Colorado, Oklahoma and New Mexico and canceled a portion of the indebtedness owed by
Savary Island to Cricket. In connection with this transaction we recognized a non-cash net gain of approximately
$20.5 million.
On November 3, 2011, Savary Island entered into a license purchase agreement with Verizon Wireless to
sell AWS spectrum in various markets to Verizon Wireless for $172 million. Savary Island has agreed to use
substantially all of the proceeds from this sale to prepay a portion of its indebtedness to Cricket at the closing of
80