Cricket Wireless 2011 Annual Report Download - page 145
Download and view the complete annual report
Please find page 145 of the 2011 Cricket Wireless annual report below. You can navigate through the pages in the report by either clicking on the pages listed below, or by using the keyword search tool below to find specific information within the annual report.-
 1
1 -
2
-
3
-
4
-
5
-
6
-
7
-
8
-
9
-
10
-
11
-
12
-
13
-
14
-
15
-
16
-
17
-
18
-
19
-
20
-
21
-
22
-
23
-
24
-
25
-
26
-
27
-
28
-
29
-
30
-
31
-
32
-
33
-
34
-
35
-
36
-
37
-
38
-
39
-
40
-
41
-
42
-
43
-
44
-
45
-
46
-
47
-
48
-
49
-
50
-
51
-
52
-
53
-
54
-
55
-
56
-
57
-
58
-
59
-
60
-
61
-
62
-
63
-
64
-
65
-
66
-
67
-
68
-
69
-
70
-
71
-
72
-
73
-
74
-
75
-
76
-
77
-
78
-
79
-
80
-
81
-
82
-
83
-
84
-
85
-
86
-
87
-
88
-
89
-
90
-
91
-
92
-
93
-
94
-
95
-
96
-
97
-
98
-
99
-
100
-
101
-
102
-
103
-
104
-
105
-
106
-
107
-
108
-
109
-
110
-
111
-
112
-
113
-
114
-
115
-
116
-
117
-
118
-
119
-
120
-
121
-
122
-
123
-
124
-
125
-
126
-
127
-
128
-
129
-
130
-
131
-
132
-
133
-
134
-
 135
135 -
 136
136 -
 137
137 -
 138
138 -
 139
139 -
 140
140 -
 141
141 -
 142
142 -
 143
143 -
 144
144 -
 145
145 -
 146
146 -
 147
147 -
 148
148 -
 149
149 -
 150
150 -
 151
151 -
 152
152 -
 153
153 -
 154
154 -
 155
155 -
156
-
157
-
158
-
159
-
160
-
161
-
162
-
163
-
164
 |
 |

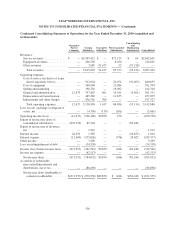
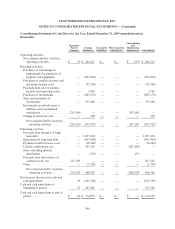
LEAP WIRELESS INTERNATIONAL, INC.
NOTES TO CONSOLIDATED FINANCIAL STATEMENTS — (Continued)
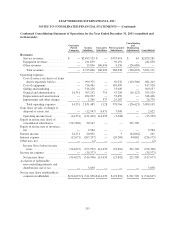
Condensed Consolidating Statement of Operations for the Year Ended December 31, 2011 (unaudited and
in thousands):
Guarantor
Parent
Company
Issuing
Subsidiary
Guarantor
Subsidiary
Non-Guarantor
Subsidiaries
Consolidating
and
Eliminating
Adjustments Consolidated
Revenues:
Service revenues ............... $ — $2,495,525 $ — $333,691 $ 65 $2,829,281
Equipment revenues ............ — 211,659 — 30,191 — 241,850
Other revenues ................. — 15,836 106,696 4,156 (126,688) —
Total revenues ............... — 2,723,020 106,696 368,038 (126,623) 3,071,131
Operating expenses:
Cost of service (exclusive of items
shown separately below) ....... — 999,371 — 92,332 (110,500) 981,203
Cost of equipment .............. — 716,461 — 101,459 — 817,920
Selling and marketing ........... — 316,228 — 53,029 — 369,257
General and administrative ....... 14,351 303,252 751 53,298 (16,123) 355,529
Depreciation and amortization .... — 494,967 — 53,459 — 548,426
Impairments and other charges .... — 1,206 377 25,187 — 26,770
Total operating expenses ....... 14,351 2,831,485 1,128 378,764 (126,623) 3,099,105
Gain (loss) on sale, exchange or
disposal of assets, net ........... — (12,947) 8,471 7,098 — 2,622
Operating income (loss) ......... (14,351) (121,412) 114,039 (3,628) — (25,352)
Equity in net income (loss) of
consolidated subsidiaries ......... (311,856) 90,147 — — 221,709 —
Equity in net income of investees,
net .......................... — 2,984 — — — 2,984
Interest income .................. 24,251 20,051 — 5 (44,062) 245
Interest expense .................. (12,671) (267,297) — (20,269) 44,062 (256,175)
Other loss, net ................... — (2) — — — (2)
Income (loss) before income
taxes ....................... (314,627) (275,529) 114,039 (23,892) 221,709 (278,300)
Income tax expense ............... — (39,377) — — — (39,377)
Net income (loss) ............... (314,627) (314,906) 114,039 (23,892) 221,709 (317,677)
Accretion of redeemable
non-controlling interests and
distributions, net of tax .......... — 3,050 — — — 3,050
Net income (loss) attributable to
common stockholders ........... $(314,627) $ (311,856) $114,039 $ (23,892) $ 221,709 $ (314,627)
135