Cricket Wireless 2011 Annual Report Download - page 81
Download and view the complete annual report
Please find page 81 of the 2011 Cricket Wireless annual report below. You can navigate through the pages in the report by either clicking on the pages listed below, or by using the keyword search tool below to find specific information within the annual report.
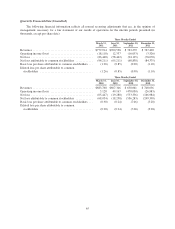
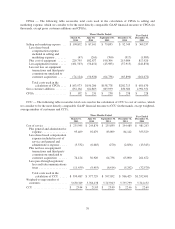
Adjusted OIBDA — The following table reconciles adjusted OIBDA to operating income (loss), which we
consider to be the most directly comparable GAAP financial measure to adjusted OIBDA (in thousands):
Three Months Ended Year Ended
December 31,
2011
March 31,
2011
June 30,
2011
September 30,
2011
December 31,
2011
Operating income (loss) ............ $(18,110) $ 12,337 $ (16,053) $ (3,526) $ (25,352)
Plus depreciation and
amortization ................. 126,674 136,137 144,904 140,711 548,426
OIBDA ......................... $108,564 $148,474 $128,851 $137,185 $523,074
Plus (gain) loss on sale, exchange or
disposal of assets, net .......... 349 4,646 678 (8,295) (2,622)
Plus impairments and other
charges ..................... — 631 23,693 2,446 26,770
Plus share-based compensation
expense ..................... 3,579 6,946 1,030 3,773 15,328
Adjusted OIBDA ................. $112,492 $160,697 $154,252 $135,109 $562,550
Liquidity and Capital Resources
Overview
Our principal sources of liquidity are our existing unrestricted cash, cash equivalents and short-term
investments and cash generated from operations. From time to time, we may also generate additional liquidity by
selling non-core assets or through future capital market transactions. We had a total of $751.0 million in
unrestricted cash, cash equivalents and short-term investments as of December 31, 2011. We generated $387.5
million of net cash from operating activities during the year ended December 31, 2011, and we expect that cash
from operations will continue to be a significant and increasing source of liquidity as our markets and product
offerings continue to develop and our business continues to grow. We believe that our existing unrestricted cash,
cash equivalents and short term investments, together with cash generated from operations, provide us with
sufficient liquidity to meet the future operating and capital requirements for our current business operations, as
well as our current business investment initiatives.
Our current business investment initiatives include our plan to deploy next-generation LTE network
technology across approximately two-thirds of our current network footprint over the next two to three years. We
successfully launched a commercial trial market in late 2011 and plan to cover up to approximately 25 million
POPs with LTE in 2012. Other current business investment initiatives include the ongoing maintenance and
development of our network and other business assets to allow us to continue to provide customers with high-
quality service. In addition, we plan to continue to strengthen and expand our distribution, including through the
wholesale agreement we have entered into, which we use to offer Cricket services in nationwide retailers outside
of our current network footprint. For our estimate of total capital expenditures for fiscal 2012, and projected
capital expenditures for these current business investment initiatives over the next several years, see the
discussion below under “— Capital Expenditures, Significant Acquisitions and Other Transactions.”
We may also pursue other activities to build our business, which could be significant. As we continue to
expand the size and scope of our business, we may enter into agreements with other vendors that contain
significant purchase or revenue commitments to enable us to obtain more favorable overall terms and conditions
for attractive products and services. Other business investment initiatives could include the launch of additional
new product and service offerings, the acquisition of additional spectrum through private transactions or FCC
auctions, the build-out and launch of new markets, entering into partnerships with others or the acquisition of all
or portions of other wireless communications companies or complementary businesses. We do not intend to
pursue any of these other business investment initiatives at a significant level unless we believe we have
sufficient liquidity to support the operating and capital requirements for our current business operations, our
current business investment initiatives and any such other activities.
71


