Cricket Wireless 2011 Annual Report Download - page 80
Download and view the complete annual report
Please find page 80 of the 2011 Cricket Wireless annual report below. You can navigate through the pages in the report by either clicking on the pages listed below, or by using the keyword search tool below to find specific information within the annual report.-
 1
1 -
2
-
3
-
4
-
5
-
6
-
7
-
8
-
9
-
10
-
11
-
12
-
13
-
14
-
15
-
16
-
17
-
18
-
19
-
20
-
21
-
22
-
23
-
24
-
25
-
26
-
27
-
28
-
29
-
30
-
31
-
32
-
33
-
34
-
35
-
36
-
37
-
38
-
39
-
40
-
41
-
42
-
43
-
44
-
45
-
46
-
47
-
48
-
49
-
50
-
51
-
52
-
53
-
54
-
55
-
56
-
57
-
58
-
59
-
60
-
61
-
62
-
63
-
64
-
65
-
66
-
67
-
68
-
69
-
 70
70 -
 71
71 -
 72
72 -
 73
73 -
 74
74 -
 75
75 -
 76
76 -
 77
77 -
 78
78 -
 79
79 -
 80
80 -
 81
81 -
 82
82 -
 83
83 -
 84
84 -
 85
85 -
 86
86 -
 87
87 -
 88
88 -
 89
89 -
 90
90 -
91
-
92
-
93
-
94
-
95
-
96
-
97
-
98
-
99
-
100
-
101
-
102
-
103
-
104
-
105
-
106
-
107
-
108
-
109
-
110
-
111
-
112
-
113
-
114
-
115
-
116
-
117
-
118
-
119
-
120
-
121
-
122
-
123
-
124
-
125
-
126
-
127
-
128
-
129
-
130
-
131
-
132
-
133
-
134
-
135
-
136
-
137
-
138
-
139
-
140
-
141
-
142
-
143
-
144
-
145
-
146
-
147
-
148
-
149
-
150
-
151
-
152
-
153
-
154
-
155
-
156
-
157
-
158
-
159
-
160
-
161
-
162
-
163
-
164
 |
 |

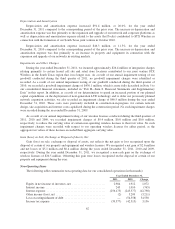
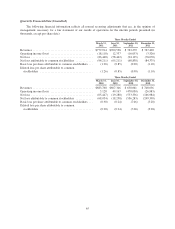
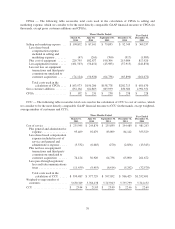
CPGA — The following table reconciles total costs used in the calculation of CPGA to selling and
marketing expense, which we consider to be the most directly comparable GAAP financial measure to CPGA (in
thousands, except gross customer additions and CPGA):
Three Months Ended Year Ended
December 31,
2011
March 31,
2011
June 30,
2011
September 30,
2011
December 31,
2011
Selling and marketing expense . . . $ 109,852 $ 87,161 $ 79,895 $ 92,349 $ 369,257
Less share-based
compensation expense
included in selling and
marketing expense ........ (47) (261) (760) (917) (1,985)
Plus cost of equipment ...... 229,795 182,677 190,364 215,084 817,920
Less equipment revenue ..... (101,503) (56,451) (45,983) (37,913) (241,850)
Less net loss on equipment
transactions and third-party
commissions unrelated to
customer acquisition ...... (74,124) (56,920) (64,738) (65,890) (261,672)
Total costs used in the
calculation of CPGA .... $163,973 $156,206 $158,778 $202,713 $ 681,670
Gross customer additions ........ 852,164 622,863 665,939 850,386 2,991,352
CPGA ....................... $ 192 $ 251 $ 238 $ 238 $ 228
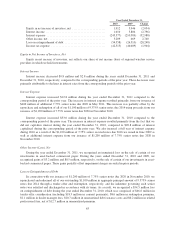
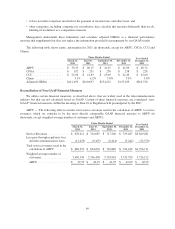
CCU — The following table reconciles total costs used in the calculation of CCU to cost of service, which
we consider to be the most directly comparable GAAP financial measure to CCU (in thousands, except weighted-
average number of customers and CCU):
Three Months Ended Year Ended
December 31,
2011
March 31,
2011
June 30,
2011
September 30,
2011
December 31,
2011
Cost of service ................. $ 235,945 $ 244,870 $ 255,899 $ 244,489 $ 981,203
Plus general and administrative
expense ................. 95,409 92,079 83,899 84,142 355,529
Less share-based compensation
expense included in cost of
service and general and
administrative expense ..... (3,532) (6,685) (270) (2,856) (13,343)
Plus net loss on equipment
transactions and third-party
commissions unrelated to
customer acquisition ...... 74,124 56,920 64,738 65,890 261,672
Less pass-through regulatory
fees and telecommunications
taxes ................... (11,459) (9,455) (6,414) (5,242) (32,570)
Total costs used in the
calculation of CCU ..... $ 390,487 $ 377,729 $ 397,852 $ 386,423 $1,552,491
Weighted-average number of
customers .................. 5,650,349 5,766,438 5,743,943 5,735,799 5,724,152
CCU ........................ $ 23.04 $ 21.83 $ 23.09 $ 22.46 $ 22.60
70