Cisco 2013 Annual Report Download - page 98
Download and view the complete annual report
Please find page 98 of the 2013 Cisco annual report below. You can navigate through the pages in the report by either clicking on the pages listed below, or by using the keyword search tool below to find specific information within the annual report.-
 1
1 -
2
-
3
-
4
-
5
-
6
-
7
-
8
-
9
-
10
-
11
-
12
-
13
-
14
-
15
-
16
-
17
-
18
-
19
-
20
-
21
-
22
-
23
-
24
-
25
-
26
-
27
-
28
-
29
-
30
-
31
-
32
-
33
-
34
-
35
-
36
-
37
-
38
-
39
-
40
-
41
-
42
-
43
-
44
-
45
-
46
-
47
-
48
-
49
-
50
-
51
-
52
-
53
-
54
-
55
-
56
-
57
-
58
-
59
-
60
-
61
-
62
-
63
-
64
-
65
-
66
-
67
-
68
-
69
-
70
-
71
-
72
-
73
-
74
-
75
-
76
-
77
-
78
-
79
-
80
-
81
-
82
-
83
-
84
-
85
-
86
-
87
-
 88
88 -
 89
89 -
 90
90 -
 91
91 -
 92
92 -
 93
93 -
 94
94 -
 95
95 -
 96
96 -
 97
97 -
 98
98 -
 99
99 -
 100
100 -
 101
101 -
 102
102 -
 103
103 -
 104
104 -
 105
105 -
 106
106 -
 107
107 -
 108
108 -
109
-
110
-
111
-
112
-
113
-
114
-
115
-
116
-
117
-
118
-
119
-
120
-
121
-
122
-
123
-
124
-
125
-
126
-
127
-
128
-
129
-
130
-
131
-
132
-
133
-
134
-
135
-
136
-
137
-
138
-
139
-
140
 |
 |

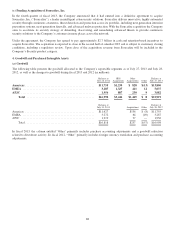
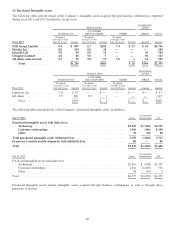
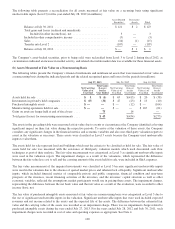
The following table presents the amortization of purchased intangible assets (in millions):
Years Ended July 27, 2013 July 28, 2012 July 30, 2011
Amortization of purchased intangible assets:
Cost of sales ............................................ $ 606 $424 $ 492
Operating expenses:
Amortizationofpurchasedintangibleassets .............
395 383 520
Restructuring and other charges ..................... ——8
Total .............................................. $1,001 $807 $1,020
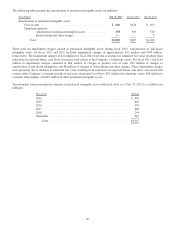
There were no impairment charges related to purchased intangible assets during fiscal 2013. Amortization of purchased
intangible assets for fiscal 2012 and 2011 included impairment charges of approximately $12 million and $164 million,
respectively. The impairment charges of $12 million for fiscal 2012 were due to declines in estimated fair value resulting from
reductions in expected future cash flows associated with certain of the Company’s technology assets. For fiscal 2011, the $164
million in impairment charges consisted of $64 million of charges to product cost of sales, $92 million of charges to
amortization of purchased intangibles, and $8 million of charges to restructuring and other charges. These impairment charges
were primarily due to declines in estimated fair value resulting from reductions in expected future cash flows associated with
certain of the Company’s consumer products and were categorized as follows: $97 million in technology assets, $40 million in
customer relationships, and $27 million in other purchased intangible assets.
The estimated future amortization expense of purchased intangible assets with finite lives as of July 27, 2013 is as follows (in
millions):
Fiscal Year Amount
2014 ......................................................... $ 903
2015 ......................................................... 820
2016 ......................................................... 593
2017 ......................................................... 440
2018 ......................................................... 294
Thereafter ..................................................... 267
Total ..................................................... $3,317
90