Cisco 2013 Annual Report Download - page 128
Download and view the complete annual report
Please find page 128 of the 2013 Cisco annual report below. You can navigate through the pages in the report by either clicking on the pages listed below, or by using the keyword search tool below to find specific information within the annual report.-
 1
1 -
2
-
3
-
4
-
5
-
6
-
7
-
8
-
9
-
10
-
11
-
12
-
13
-
14
-
15
-
16
-
17
-
18
-
19
-
20
-
21
-
22
-
23
-
24
-
25
-
26
-
27
-
28
-
29
-
30
-
31
-
32
-
33
-
34
-
35
-
36
-
37
-
38
-
39
-
40
-
41
-
42
-
43
-
44
-
45
-
46
-
47
-
48
-
49
-
50
-
51
-
52
-
53
-
54
-
55
-
56
-
57
-
58
-
59
-
60
-
61
-
62
-
63
-
64
-
65
-
66
-
67
-
68
-
69
-
70
-
71
-
72
-
73
-
74
-
75
-
76
-
77
-
78
-
79
-
80
-
81
-
82
-
83
-
84
-
85
-
86
-
87
-
88
-
89
-
90
-
91
-
92
-
93
-
94
-
95
-
96
-
97
-
98
-
99
-
100
-
101
-
102
-
103
-
104
-
105
-
106
-
107
-
108
-
109
-
110
-
111
-
112
-
113
-
114
-
115
-
116
-
117
-
 118
118 -
 119
119 -
 120
120 -
 121
121 -
 122
122 -
 123
123 -
 124
124 -
 125
125 -
 126
126 -
 127
127 -
 128
128 -
 129
129 -
 130
130 -
 131
131 -
 132
132 -
 133
133 -
 134
134 -
 135
135 -
 136
136 -
 137
137 -
 138
138 -
139
-
140
 |
 |

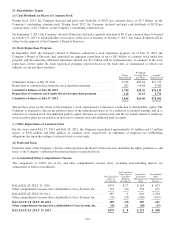
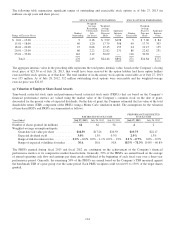
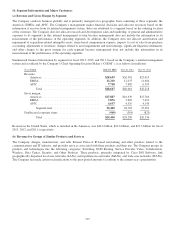
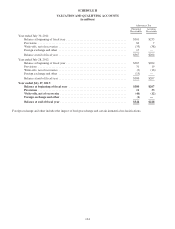
The following table presents revenue for groups of similar products and services (in millions):
Years Ended July 27, 2013 July 28, 2012 July 30, 2011
Revenue:
Switching ...................................... $14,741 $14,589 $14,177
NGN Routing ................................... 8,230 8,382 8,186
Service Provider Video ........................... 4,852 3,861 3,515
Collaboration ................................... 3,956 4,193 4,072
Wireless ....................................... 2,166 1,659 1,400
Data Center ..................................... 2,073 1,298 696
Security ........................................ 1,347 1,341 1,191
Other .......................................... 664 1,003 1,289
Product .................................... 38,029 36,326 34,526
Service .................................... 10,578 9,735 8,692
Total .................................. $48,607 $46,061 $43,218
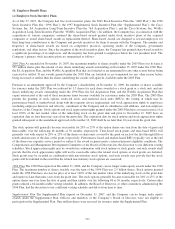
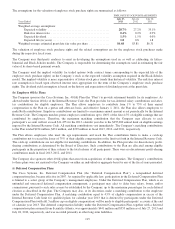
(c) Additional Segment Information
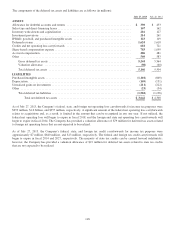
The majority of the Company’s assets, excluding cash and cash equivalents and investments, as of July 27, 2013 and July 28,
2012 were attributable to its U.S. operations. The Company’s total cash and cash equivalents and investments held by various
foreign subsidiaries were $40.4 billion and $42.5 billion as of July 27, 2013 and July 28, 2012, respectively, and the remaining
$10.2 billion and $6.2 billion at the respective fiscal year ends was available in the United States. In fiscal 2013, 2012, and
2011, no single customer accounted for 10% or more of the Company’s revenue.
Property and equipment information is based on the physical location of the assets. The following table presents property and
equipment information for geographic areas (in millions):
July 27, 2013 July 28, 2012 July 30, 2011
Property and equipment, net:
United States .................................... $2,780 $2,842 $3,284
International .................................... 542 560 632
Total ...................................... $3,322 $3,402 $3,916
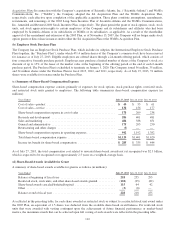
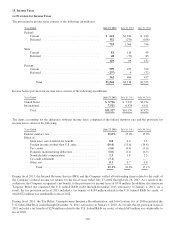
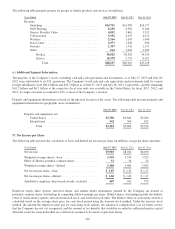
17. Net Income per Share
The following table presents the calculation of basic and diluted net income per share (in millions, except per-share amounts):
Years Ended July 27, 2013 July 28, 2012 July 30, 2011
Net income ......................................... $9,983 $8,041 $6,490
Weighted-average shares—basic ........................ 5,329 5,370 5,529
Effect of dilutive potential common shares ................ 51 34 34
Weighted-average shares—diluted ...................... 5,380 5,404 5,563
Net income per share—basic ........................... $ 1.87 $ 1.50 $ 1.17
Net income per share—diluted .......................... $ 1.86 $ 1.49 $ 1.17
Antidilutive employee share-based awards, excluded ........ 407 591 379
Employee equity share options, unvested shares, and similar equity instruments granted by the Company are treated as
potential common shares outstanding in computing diluted earnings per share. Diluted shares outstanding include the dilutive
effect of in-the-money options, unvested restricted stock, and restricted stock units. The dilutive effect of such equity awards is
calculated based on the average share price for each fiscal period using the treasury stock method. Under the treasury stock
method, the amount the employee must pay for exercising stock options, the amount of compensation cost for future service
that the Company has not yet recognized, and the amount of tax benefits that would be recorded in additional paid-in capital
when the award becomes deductible are collectively assumed to be used to repurchase shares.
120