Cisco 2013 Annual Report Download - page 56
Download and view the complete annual report
Please find page 56 of the 2013 Cisco annual report below. You can navigate through the pages in the report by either clicking on the pages listed below, or by using the keyword search tool below to find specific information within the annual report.-
 1
1 -
2
-
3
-
4
-
5
-
6
-
7
-
8
-
9
-
10
-
11
-
12
-
13
-
14
-
15
-
16
-
17
-
18
-
19
-
20
-
21
-
22
-
23
-
24
-
25
-
26
-
27
-
28
-
29
-
30
-
31
-
32
-
33
-
34
-
35
-
36
-
37
-
38
-
39
-
40
-
41
-
42
-
43
-
44
-
45
-
 46
46 -
 47
47 -
 48
48 -
 49
49 -
 50
50 -
 51
51 -
 52
52 -
 53
53 -
 54
54 -
 55
55 -
 56
56 -
 57
57 -
 58
58 -
 59
59 -
 60
60 -
 61
61 -
 62
62 -
 63
63 -
 64
64 -
 65
65 -
 66
66 -
67
-
68
-
69
-
70
-
71
-
72
-
73
-
74
-
75
-
76
-
77
-
78
-
79
-
80
-
81
-
82
-
83
-
84
-
85
-
86
-
87
-
88
-
89
-
90
-
91
-
92
-
93
-
94
-
95
-
96
-
97
-
98
-
99
-
100
-
101
-
102
-
103
-
104
-
105
-
106
-
107
-
108
-
109
-
110
-
111
-
112
-
113
-
114
-
115
-
116
-
117
-
118
-
119
-
120
-
121
-
122
-
123
-
124
-
125
-
126
-
127
-
128
-
129
-
130
-
131
-
132
-
133
-
134
-
135
-
136
-
137
-
138
-
139
-
140
 |
 |

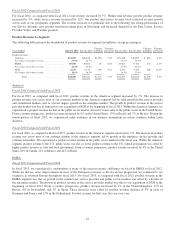
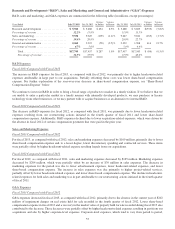
Fiscal 2012 Compared with Fiscal 2011
For fiscal 2012, as compared with fiscal 2011, product revenue in the EMEA segment increased by 2%. The increase was
across most of our customer markets in the EMEA segment, led by growth in the commercial, enterprise and public sector
markets. We experienced a slight decline in product revenue in the service provider customer market during the fiscal year
driven by lower revenue from this customer market in several of the large countries in the region. From a country perspective,
product revenue increased by 11% in the United Kingdom, 15% in Russia, and 9% in the Netherlands. These increases were
partially offset by product revenue declines of 23% in Italy, 21% in Spain, 2% in Germany, and 1% in France.
We believe that the slower growth we experienced in EMEA was a result of weak macroeconomic conditions attributable in
large part to the austerity measures taking place in parts of the region. In particular, we experienced weakness in this segment
during the second half of fiscal 2012, with a year-over-year decline in product revenue in this segment during the fourth
quarter.
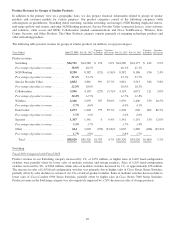
APJC
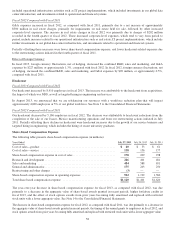
Fiscal 2013 Compared with Fiscal 2012
For fiscal 2013, as compared with fiscal 2012, product revenue in the APJC segment increased by 3%. We experienced solid
product revenue growth in the commercial and service provider markets and, to a lesser degree, in the public sector market.
The growth in product revenue in the service provider market was due primarily to our acquisition of NDS at the beginning of
fiscal 2013. From a country perspective, product revenue increased by 3% in Australia, 34% in India, and 10% in South Korea.
These increases were partially offset by product revenue declines of 5% in China and 7% in Japan, reflecting certain
challenges that we faced in these countries during portions of fiscal 2013, most notably in the fourth quarter of fiscal 2013.
Fiscal 2012 Compared with Fiscal 2011
For fiscal 2012, as compared with fiscal 2011, product revenue in the APJC segment increased by 13%. The increase was led
by strong product revenue growth in the service provider market, and to a lesser degree, in the commercial, enterprise and
public sector markets. From a country perspective, product revenue increased by 27% in Japan, 17% in China, and 12% in
Australia. We experienced a year-over-year product revenue decline of 19% in South Korea, and 4% in India. Our revenue
decline in India was due to ongoing business momentum challenges in the public sector customer market.
48