Cisco 2013 Annual Report Download - page 45
Download and view the complete annual report
Please find page 45 of the 2013 Cisco annual report below. You can navigate through the pages in the report by either clicking on the pages listed below, or by using the keyword search tool below to find specific information within the annual report.-
 1
1 -
2
-
3
-
4
-
5
-
6
-
7
-
8
-
9
-
10
-
11
-
12
-
13
-
14
-
15
-
16
-
17
-
18
-
19
-
20
-
21
-
22
-
23
-
24
-
25
-
26
-
27
-
28
-
29
-
30
-
31
-
32
-
33
-
34
-
 35
35 -
 36
36 -
 37
37 -
 38
38 -
 39
39 -
 40
40 -
 41
41 -
 42
42 -
 43
43 -
 44
44 -
 45
45 -
 46
46 -
 47
47 -
 48
48 -
 49
49 -
 50
50 -
 51
51 -
 52
52 -
 53
53 -
 54
54 -
 55
55 -
56
-
57
-
58
-
59
-
60
-
61
-
62
-
63
-
64
-
65
-
66
-
67
-
68
-
69
-
70
-
71
-
72
-
73
-
74
-
75
-
76
-
77
-
78
-
79
-
80
-
81
-
82
-
83
-
84
-
85
-
86
-
87
-
88
-
89
-
90
-
91
-
92
-
93
-
94
-
95
-
96
-
97
-
98
-
99
-
100
-
101
-
102
-
103
-
104
-
105
-
106
-
107
-
108
-
109
-
110
-
111
-
112
-
113
-
114
-
115
-
116
-
117
-
118
-
119
-
120
-
121
-
122
-
123
-
124
-
125
-
126
-
127
-
128
-
129
-
130
-
131
-
132
-
133
-
134
-
135
-
136
-
137
-
138
-
139
-
140
 |
 |

Item 7. Management’s Discussion and Analysis of Financial Condition and Results of Operations
Forward-Looking Statements
This Annual Report on Form 10-K, including this Management’s Discussion and Analysis of Financial Condition and Results
of Operations, contains forward-looking statements regarding future events and our future results that are subject to the safe
harbors created under the Securities Act of 1933 (the “Securities Act”) and the Securities Exchange Act of 1934 (the
“Exchange Act”). All statements other than statements of historical facts are statements that could be deemed forward-looking
statements. These statements are based on current expectations, estimates, forecasts, and projections about the industries in
which we operate and the beliefs and assumptions of our management. Words such as “expects,” “anticipates,” “targets,”
“goals,” “projects,” “intends,” “plans,” “believes,” “seeks,” “estimates,” “continues,” “endeavors,” “strives,” “may,” variations
of such words, and similar expressions are intended to identify such forward-looking statements. In addition, any statements
that refer to projections of our future financial performance, our anticipated growth and trends in our businesses, and other
characterizations of future events or circumstances are forward-looking statements. Readers are cautioned that these forward-
looking statements are only predictions and are subject to risks, uncertainties, and assumptions that are difficult to predict,
including those identified below, under “Part I, Item 1A. Risk Factors,” and elsewhere herein. Therefore, actual results may
differ materially and adversely from those expressed in any forward-looking statements. We undertake no obligation to revise
or update any forward-looking statements for any reason.
OVERVIEW
We design, manufacture, and sell Internet Protocol (IP) based networking and other products related to the communications
and information technology (IT) industry and provide services associated with these products and their use. We provide a
broad line of products for transporting data, voice, and video within buildings, across campuses, and around the world. Our
products are designed to transform how people connect, communicate, and collaborate. Our products are utilized at enterprise
businesses, public institutions, telecommunications companies and other service providers, commercial businesses, and
personal residences.
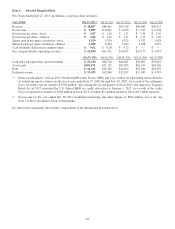
A summary of our results is as follows (in millions, except percentages and per-share amounts):
Three Months Ended Fiscal Year Ended
July 27,
2013
July 28,
2012 Variance
July 27,
2013
July 28,
2012 Variance
Revenue ......................................... $12,417 $11,690 6.2% $48,607 $46,061 5.5%
Gross margin percentage ............................ 59.2% 60.6% (1.4)pts 60.6% 61.2% (0.6)pts
Research and development .......................... $ 1,517 $ 1,416 7.1% $ 5,942 $ 5,488 8.3%
Sales and marketing ............................... $ 2,360 $ 2,417 (2.4)% $ 9,538 $ 9,647 (1.1)%
General and administrative .......................... $ 590 $ 711 (17.0)% $ 2,264 $ 2,322 (2.5)%
Total R&D, sales and marketing, general and
administrative .................................. $ 4,467 $ 4,544 (1.7)% $17,744 $17,457 1.6%
Total as a percentage of revenue ...................... 36.0% 38.9% (2.9)pts 36.5% 37.9% (1.4)pts
Amortization of purchased intangible assets ............ $66$ 91 (27.5)% $ 395 $ 383 3.1%
Restructuring and other charges ...................... $— $ 79 (100.0)% $ 105 $ 304 (65.5)%
Operating income as a percentage of revenue ........... 22.7% 20.3% 2.4pts 23.0% 21.9% 1.1pts
Income tax percentage ............................. 20.9% 19.7% 1.2pts 11.1% 20.8% (9.7)pts
Net income ...................................... $ 2,270 $ 1,917 18.4% $ 9,983 $ 8,041 24.2%
Net income as a percentage of revenue ................. 18.3% 16.4% 1.9pts 20.5% 17.5% 3.0pts
Earnings per share—diluted ......................... $ 0.42 $ 0.36 16.7% $ 1.86 $ 1.49 24.8%
37