Cisco 2013 Annual Report Download - page 42
Download and view the complete annual report
Please find page 42 of the 2013 Cisco annual report below. You can navigate through the pages in the report by either clicking on the pages listed below, or by using the keyword search tool below to find specific information within the annual report.-
 1
1 -
2
-
3
-
4
-
5
-
6
-
7
-
8
-
9
-
10
-
11
-
12
-
13
-
14
-
15
-
16
-
17
-
18
-
19
-
20
-
21
-
22
-
23
-
24
-
25
-
26
-
27
-
28
-
29
-
30
-
31
-
 32
32 -
 33
33 -
 34
34 -
 35
35 -
 36
36 -
 37
37 -
 38
38 -
 39
39 -
 40
40 -
 41
41 -
 42
42 -
 43
43 -
 44
44 -
 45
45 -
 46
46 -
 47
47 -
 48
48 -
 49
49 -
 50
50 -
 51
51 -
 52
52 -
53
-
54
-
55
-
56
-
57
-
58
-
59
-
60
-
61
-
62
-
63
-
64
-
65
-
66
-
67
-
68
-
69
-
70
-
71
-
72
-
73
-
74
-
75
-
76
-
77
-
78
-
79
-
80
-
81
-
82
-
83
-
84
-
85
-
86
-
87
-
88
-
89
-
90
-
91
-
92
-
93
-
94
-
95
-
96
-
97
-
98
-
99
-
100
-
101
-
102
-
103
-
104
-
105
-
106
-
107
-
108
-
109
-
110
-
111
-
112
-
113
-
114
-
115
-
116
-
117
-
118
-
119
-
120
-
121
-
122
-
123
-
124
-
125
-
126
-
127
-
128
-
129
-
130
-
131
-
132
-
133
-
134
-
135
-
136
-
137
-
138
-
139
-
140
 |
 |

PART II
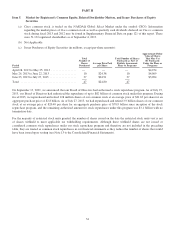
Item 5. Market for Registrant’s Common Equity, Related Stockholder Matters, and Issuer Purchases of Equity
Securities
(a) Cisco common stock is traded on the NASDAQ Global Select Market under the symbol CSCO. Information
regarding the market prices of Cisco common stock as well as quarterly cash dividends declared on Cisco’s common
stock during fiscal 2013 and 2012 may be found in Supplementary Financial Data on page 121 of this report. There
were 51,132 registered shareholders as of September 4, 2013.
(b) Not Applicable.
(c) Issuer Purchases of Equity Securities (in millions, except per-share amounts):
Period
Total
Number of
Shares
Purchased
Average Price Paid
per Share
Total Number of Shares
Purchased as Part of
Publicly Announced
Plans or Programs
Approximate Dollar
Value of Shares
That May Yet
Be Purchased
Under the Plans or
Programs
April 28, 2013 to May 25, 2013 ................. — — — $4,254
May 26, 2013 to June 22, 2013 .................. 10 $24.38 10 $4,009
June 23, 2013 to July 27, 2013 .................. 37 $24.91 37 $3,094
Total ...................................... 47 $24.80 47
On September 13, 2001, we announced that our Board of Directors had authorized a stock repurchase program. As of July 27,
2013, our Board of Directors had authorized the repurchase of up to $82 billion of common stock under this program. During
fiscal 2013, we repurchased and retired 128 million shares of our common stock at an average price of $21.63 per share for an
aggregate purchase price of $2.8 billion. As of July 27, 2013, we had repurchased and retired 3.9 billion shares of our common
stock at an average price of $20.40 per share for an aggregate purchase price of $78.9 billion since inception of the stock
repurchase program, and the remaining authorized amount for stock repurchases under this program was $3.1 billion with no
termination date.
For the majority of restricted stock units granted, the number of shares issued on the date the restricted stock units vest is net
of shares withheld to meet applicable tax withholding requirements. Although these withheld shares are not issued or
considered common stock repurchases under our stock repurchase program and therefore are not included in the preceding
table, they are treated as common stock repurchases in our financial statements as they reduce the number of shares that would
have been issued upon vesting (see Note 13 to the Consolidated Financial Statements).
34