Cisco 2013 Annual Report Download - page 108
Download and view the complete annual report
Please find page 108 of the 2013 Cisco annual report below. You can navigate through the pages in the report by either clicking on the pages listed below, or by using the keyword search tool below to find specific information within the annual report.-
 1
1 -
2
-
3
-
4
-
5
-
6
-
7
-
8
-
9
-
10
-
11
-
12
-
13
-
14
-
15
-
16
-
17
-
18
-
19
-
20
-
21
-
22
-
23
-
24
-
25
-
26
-
27
-
28
-
29
-
30
-
31
-
32
-
33
-
34
-
35
-
36
-
37
-
38
-
39
-
40
-
41
-
42
-
43
-
44
-
45
-
46
-
47
-
48
-
49
-
50
-
51
-
52
-
53
-
54
-
55
-
56
-
57
-
58
-
59
-
60
-
61
-
62
-
63
-
64
-
65
-
66
-
67
-
68
-
69
-
70
-
71
-
72
-
73
-
74
-
75
-
76
-
77
-
78
-
79
-
80
-
81
-
82
-
83
-
84
-
85
-
86
-
87
-
88
-
89
-
90
-
91
-
92
-
93
-
94
-
95
-
96
-
97
-
 98
98 -
 99
99 -
 100
100 -
 101
101 -
 102
102 -
 103
103 -
 104
104 -
 105
105 -
 106
106 -
 107
107 -
 108
108 -
 109
109 -
 110
110 -
 111
111 -
 112
112 -
 113
113 -
 114
114 -
 115
115 -
 116
116 -
 117
117 -
 118
118 -
119
-
120
-
121
-
122
-
123
-
124
-
125
-
126
-
127
-
128
-
129
-
130
-
131
-
132
-
133
-
134
-
135
-
136
-
137
-
138
-
139
-
140
 |
 |

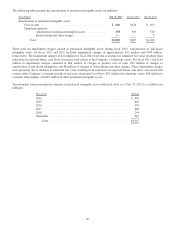
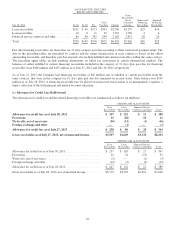
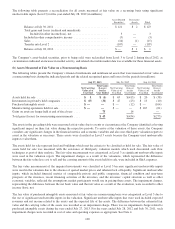
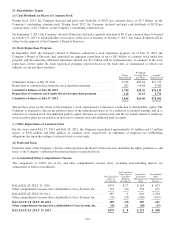
The following table presents a reconciliation for all assets measured at fair value on a recurring basis using significant
unobservable inputs (Level 3) for the year ended July 28, 2012 (in millions):
Asset-Backed
Securities
Derivative
Assets Total
Balance at July 30, 2011 .................................... $121 $ 2 $123
Total gains and losses (realized and unrealized):
Included in other income(loss), net ........................ 3 — 3
Included in other comprehensive income ....................... (3) — (3)
Sales .................................................... (14) (1) (15)
Transfer into Level 2 ....................................... (107) — (107)
Balance at July 28, 2012 .................................... $— $ 1 $ 1
The Company’s asset-backed securities, prior to being sold, were reclassified from Level 3 to Level 2 during fiscal 2012, as
circumstances indicated an increase in market activity, and related observable market data was available for these financial assets.
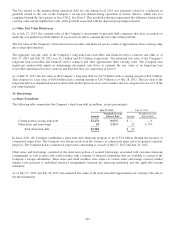
(b) Assets Measured at Fair Value on a Nonrecurring Basis
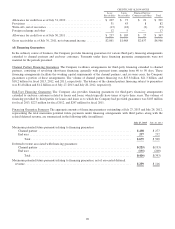
The following tables present the Company’s financial instruments and nonfinancial assets that were measured at fair value on
a nonrecurring basis during the indicated periods and the related recognized gains and losses for the periods (in millions):
July 27, 2013 July 28, 2012 July 30, 2011
Net Carrying
Value as of
Year End
Total Gains
(Losses)
for the
Year Ended
Net Carrying
Value as of
Year End
Total Gains
(Losses)
for the
Year Ended
Net Carrying
Value as of
Year End
Total Gains
(Losses)
for the
Year Ended
Assets held for sale ............................. $ 1 $ (1) $ 63 $(413) $ 20 $ (38)
Investments in privately held companies ............. $ 63 (31) $ 47 (23) $ 13 (10)
Purchased intangible assets ....................... $— — $ — (12) $ — (164)
Manufacturing operations held for sale .............. $— — $ — — $ 167 (61)
Gains on assets no longer held at end of fiscal year .... 75 14 —
Total gains (losses) for nonrecurring measurements .... $43 $(434) $(273)
The assets in the preceding table were measured at fair value due to events or circumstances the Company identified as having
significant impact on their fair value during the respective periods. To arrive at the valuation of these assets, the Company
considers any significant changes in the financial metrics and economic variables and also uses third-party valuation reports to
assist in the valuation as necessary. These assets were classified as Level 3 assets because the Company used unobservable
inputs to value them.
The assets held for sale represent land and buildings which met the criteria to be classified as held for sale. The fair value of
assets held for sale was measured with the assistance of third-party valuation models which used discounted cash flow
techniques as part of their analysis. The fair value measurement was categorized as Level 3 as significant unobservable inputs
were used in the valuation report. The impairment charges as a result of the valuations, which represented the difference
between the fair value less cost to sell and the carrying amount of the assets held for sale, were included in G&A expenses.
The fair value measurement of the impaired investments was classified as Level 3 because significant unobservable inputs
were used in the valuation due to the absence of quoted market prices and inherent lack of liquidity. Significant unobservable
inputs, which included financial metrics of comparable private and public companies, financial condition and near-term
prospects of the investees, recent financing activities of the investees, and the investees’ capital structure as well as other
economic variables, reflected the assumptions market participants would use in pricing these assets. The impairment charges,
representing the difference between the net book value and the fair value as a result of the evaluation, were recorded to other
income (loss), net.
The fair value of purchased intangible assets measured at fair value on a nonrecurring basis was categorized as Level 3 due to
the use of significant unobservable inputs in the valuation. Significant unobservable inputs that were used included expected
revenues and net income related to the assets and the expected life of the assets. The difference between the estimated fair
value and the carrying value of the assets was recorded as an impairment charge. There was no impairment charge related to
purchased intangible assets during the year ended July 27, 2013. For the years ended July 28, 2012 and July 30, 2011, such
impairment charges were recorded in cost of sales and operating expenses as appropriate. See Note 4.
100