Cisco 2013 Annual Report Download - page 60
Download and view the complete annual report
Please find page 60 of the 2013 Cisco annual report below. You can navigate through the pages in the report by either clicking on the pages listed below, or by using the keyword search tool below to find specific information within the annual report.-
 1
1 -
2
-
3
-
4
-
5
-
6
-
7
-
8
-
9
-
10
-
11
-
12
-
13
-
14
-
15
-
16
-
17
-
18
-
19
-
20
-
21
-
22
-
23
-
24
-
25
-
26
-
27
-
28
-
29
-
30
-
31
-
32
-
33
-
34
-
35
-
36
-
37
-
38
-
39
-
40
-
41
-
42
-
43
-
44
-
45
-
46
-
47
-
48
-
49
-
 50
50 -
 51
51 -
 52
52 -
 53
53 -
 54
54 -
 55
55 -
 56
56 -
 57
57 -
 58
58 -
 59
59 -
 60
60 -
 61
61 -
 62
62 -
 63
63 -
 64
64 -
 65
65 -
 66
66 -
 67
67 -
 68
68 -
 69
69 -
 70
70 -
71
-
72
-
73
-
74
-
75
-
76
-
77
-
78
-
79
-
80
-
81
-
82
-
83
-
84
-
85
-
86
-
87
-
88
-
89
-
90
-
91
-
92
-
93
-
94
-
95
-
96
-
97
-
98
-
99
-
100
-
101
-
102
-
103
-
104
-
105
-
106
-
107
-
108
-
109
-
110
-
111
-
112
-
113
-
114
-
115
-
116
-
117
-
118
-
119
-
120
-
121
-
122
-
123
-
124
-
125
-
126
-
127
-
128
-
129
-
130
-
131
-
132
-
133
-
134
-
135
-
136
-
137
-
138
-
139
-
140
 |
 |

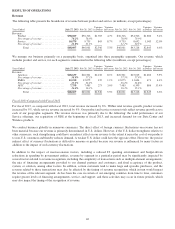
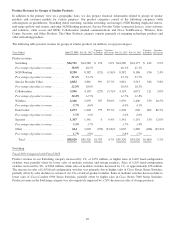
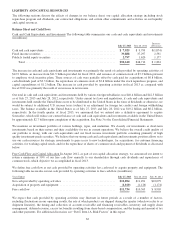
Service Revenue by Segment
The following table presents the breakdown of service revenue by segment (in millions, except percentages):
Years Ended July 27, 2013 July 28, 2012
Variance
in Dollars
Variance
in Percent July 28, 2012 July 30, 2011
Variance
in Dollars
Variance
in Percent
Service revenue:
Americas ............................... $ 6,986 $6,333 $653 10.3% $6,333 $5,723 $ 610 10.7%
Percentage of service revenue ............... 66.1% 65.0% 65.0% 65.8%
EMEA ................................. 2,161 2,051 110 5.4% 2,051 1,816 235 12.9%
Percentage of service revenue ............... 20.4% 21.1% 21.1% 20.9%
APJC .................................. 1,431 1,351 80 5.9% 1,351 1,153 198 17.2%
Percentage of service revenue ............... 13.5% 13.9% 13.9% 13.3%
Total ................................ $10,578 $9,735 $843 8.7% $9,735 $8,692 $1,043 12.0%
Fiscal 2013 Compared with Fiscal 2012
Service revenue experienced solid growth across all of our geographic segments. Worldwide technical support services
revenue increased by 6%, and worldwide advanced services, which relate to consulting support services for specific network
needs, experienced 16% revenue growth. Technical support service experienced growth across all of our geographic segments,
led by growth in our Americas segment. Renewals and technical support service contract initiations associated with product
sales provided an installed base of equipment being serviced which, in concert with new service offerings, were the primary
factors driving these increases. We experienced revenue growth in advanced services across all geographic segments, led by
growth in the Americas segment. Advanced services revenue growth was driven by solid growth in both transaction and
subscription revenues.
Fiscal 2012 Compared with Fiscal 2011
For fiscal 2012, as compared with fiscal 2011, service revenue experienced double-digit percentage growth across all of our
geographic segments. Worldwide technical support services revenue increased by 10%, and worldwide advanced services
experienced 20% revenue growth. Technical support services revenue grew across all of our geographic segments, with strong
revenue growth in our EMEA and APJC segments. Renewals and technical support service contract initiations associated with
recent product sales have resulted in a new installed base of equipment being serviced, which was the primary driver for these
increases. Advanced services revenue also grew across all geographic segments, with particularly strong growth in APJC. The
APJC revenue growth in advanced services was led by strength in the second half of fiscal 2012 and was driven by both
subscription growth and transaction growth, which was in part the result of the completion of several large, multiyear projects
in this region.
52