Cisco 2013 Annual Report Download - page 44
Download and view the complete annual report
Please find page 44 of the 2013 Cisco annual report below. You can navigate through the pages in the report by either clicking on the pages listed below, or by using the keyword search tool below to find specific information within the annual report.-
 1
1 -
2
-
3
-
4
-
5
-
6
-
7
-
8
-
9
-
10
-
11
-
12
-
13
-
14
-
15
-
16
-
17
-
18
-
19
-
20
-
21
-
22
-
23
-
24
-
25
-
26
-
27
-
28
-
29
-
30
-
31
-
32
-
33
-
 34
34 -
 35
35 -
 36
36 -
 37
37 -
 38
38 -
 39
39 -
 40
40 -
 41
41 -
 42
42 -
 43
43 -
 44
44 -
 45
45 -
 46
46 -
 47
47 -
 48
48 -
 49
49 -
 50
50 -
 51
51 -
 52
52 -
 53
53 -
 54
54 -
55
-
56
-
57
-
58
-
59
-
60
-
61
-
62
-
63
-
64
-
65
-
66
-
67
-
68
-
69
-
70
-
71
-
72
-
73
-
74
-
75
-
76
-
77
-
78
-
79
-
80
-
81
-
82
-
83
-
84
-
85
-
86
-
87
-
88
-
89
-
90
-
91
-
92
-
93
-
94
-
95
-
96
-
97
-
98
-
99
-
100
-
101
-
102
-
103
-
104
-
105
-
106
-
107
-
108
-
109
-
110
-
111
-
112
-
113
-
114
-
115
-
116
-
117
-
118
-
119
-
120
-
121
-
122
-
123
-
124
-
125
-
126
-
127
-
128
-
129
-
130
-
131
-
132
-
133
-
134
-
135
-
136
-
137
-
138
-
139
-
140
 |
 |

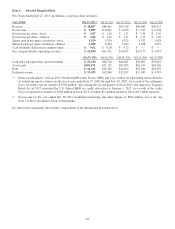
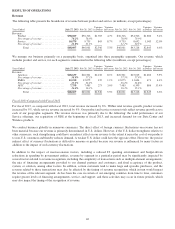
Item 6. Selected Financial Data
Five Years Ended July 27, 2013 (in millions, except per-share amounts)
Years Ended July 27, 2013 (1) July 28, 2012 July 30, 2011 (2) July 31, 2010 July 25, 2009
Revenue ...................................... $ 48,607 $46,061 $43,218 $40,040 $36,117
Net income .................................... $ 9,983 $ 8,041 $ 6,490 $ 7,767 $ 6,134
Net income per share—basic ...................... $ 1.87 $ 1.50 $ 1.17 $ 1.36 $ 1.05
Net income per share—diluted .................... $ 1.86 $ 1.49 $ 1.17 $ 1.33 $ 1.05
Shares used in per-share calculation—basic . . . . . . . . . .
5,329 5,370 5,529 5,732 5,828
Shares used in per-share calculation—diluted .........
5,380 5,404 5,563 5,848 5,857
Cash dividends declared per common share .......... $ 0.62 $ 0.28 $ 0.12 $ — $ —
Net cash provided by operating activities ............ $ 12,894 $11,491 $10,079 $10,173 $ 9,897
July 27, 2013 July 28, 2012 July 30, 2011 July 31, 2010 July 25, 2009
Cash and cash equivalents and investments .......... $ 50,610 $48,716 $44,585 $39,861 $35,001
Total assets ................................... $101,191 $91,759 $87,095 $81,130 $68,128
Debt ......................................... $ 16,211 $16,328 $16,822 $15,284 $10,295
Deferred revenue ............................... $ 13,423 $12,880 $12,207 $11,083 $ 9,393
(1) In the second quarter of fiscal 2013, the Internal Revenue Service (IRS) and Cisco settled all outstanding items related to
its federal income tax returns for the fiscal years ended July 27, 2002 through July 28, 2007. As a result of the settlement,
Cisco recorded a net tax benefit of $794 million. Also during the second quarter of fiscal 2013, the American Taxpayer
Relief Act of 2012 reinstated the U.S. federal R&D tax credit, retroactive to January 1, 2012. As a result of the credit,
Cisco recognized tax benefits of $184 million in fiscal 2013, of which $72 million related to fiscal 2012 R&D expenses.
(2) Net income for the year ended July 30, 2011 included restructuring and other charges of $694 million, net of tax. See
Note 5 to the Consolidated Financial Statements.
No other factors materially affected the comparability of the information presented above.
36