Cisco 2013 Annual Report Download - page 121
Download and view the complete annual report
Please find page 121 of the 2013 Cisco annual report below. You can navigate through the pages in the report by either clicking on the pages listed below, or by using the keyword search tool below to find specific information within the annual report.-
 1
1 -
2
-
3
-
4
-
5
-
6
-
7
-
8
-
9
-
10
-
11
-
12
-
13
-
14
-
15
-
16
-
17
-
18
-
19
-
20
-
21
-
22
-
23
-
24
-
25
-
26
-
27
-
28
-
29
-
30
-
31
-
32
-
33
-
34
-
35
-
36
-
37
-
38
-
39
-
40
-
41
-
42
-
43
-
44
-
45
-
46
-
47
-
48
-
49
-
50
-
51
-
52
-
53
-
54
-
55
-
56
-
57
-
58
-
59
-
60
-
61
-
62
-
63
-
64
-
65
-
66
-
67
-
68
-
69
-
70
-
71
-
72
-
73
-
74
-
75
-
76
-
77
-
78
-
79
-
80
-
81
-
82
-
83
-
84
-
85
-
86
-
87
-
88
-
89
-
90
-
91
-
92
-
93
-
94
-
95
-
96
-
97
-
98
-
99
-
100
-
101
-
102
-
103
-
104
-
105
-
106
-
107
-
108
-
109
-
110
-
 111
111 -
 112
112 -
 113
113 -
 114
114 -
 115
115 -
 116
116 -
 117
117 -
 118
118 -
 119
119 -
 120
120 -
 121
121 -
 122
122 -
 123
123 -
 124
124 -
 125
125 -
 126
126 -
 127
127 -
 128
128 -
 129
129 -
 130
130 -
 131
131 -
132
-
133
-
134
-
135
-
136
-
137
-
138
-
139
-
140
 |
 |

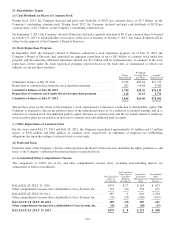
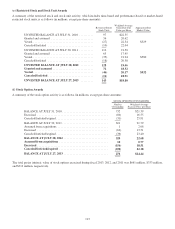
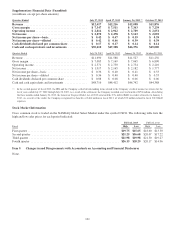
(e) Restricted Stock and Stock Unit Awards
A summary of the restricted stock and stock unit activity, which includes time-based and performance-based or market-based
restricted stock units, is as follows (in millions, except per-share amounts):
Restricted Stock/
Stock Units
Weighted-Average
Grant Date Fair
Value per Share
Aggregated Fair
Market Value
UNVESTED BALANCE AT JULY 31, 2010 .......... 97 $22.35
Granted and assumed ............................. 56 20.62
Vested ......................................... (27) 22.54 $529
Canceled/forfeited ............................... (10) 22.04
UNVESTED BALANCE AT JULY 30, 2011 .......... 116 21.50
Granted and assumed ............................. 65 17.45
Vested ......................................... (35) 21.94 $580
Canceled/forfeited ............................... (18) 20.38
UNVESTED BALANCE AT JULY 28, 2012 ......... 128 19.46
Granted and assumed ............................ 72 18.52
Vested ......................................... (46) 20.17 $932
Canceled/forfeited ............................... (11) 18.91
UNVESTED BALANCE AT JULY 27, 2013 ......... 143 $18.80
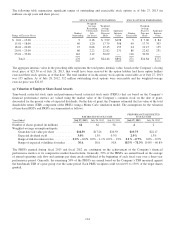
(f) Stock Option Awards
A summary of the stock option activity is as follows (in millions, except per-share amounts):
STOCK OPTIONS OUTSTANDING
Number
Outstanding
Weighted-Average
Exercise Price per Share
BALANCE AT JULY 31, 2010 ............................... 732 $21.39
Exercised ................................................ (80) 16.55
Canceled/forfeited/expired ................................... (31) 25.91
BALANCE AT JULY 30, 2011 ............................... 621 21.79
Assumed from acquisitions .................................. 1 2.08
Exercised ................................................ (66) 13.51
Canceled/forfeited/expired ................................... (36) 23.40
BALANCE AT JULY 28, 2012 .............................. 520 22.68
Assumed from acquisitions ................................. 10 0.77
Exercised ................................................ (154) 18.51
Canceled/forfeited/expired ................................. (100) 22.18
BALANCE AT JULY 27, 2013 .............................. 276 $24.44
The total pretax intrinsic value of stock options exercised during fiscal 2013, 2012, and 2011 was $661 million, $333 million,
and $312 million, respectively.
113