Cisco 2013 Annual Report Download - page 85
Download and view the complete annual report
Please find page 85 of the 2013 Cisco annual report below. You can navigate through the pages in the report by either clicking on the pages listed below, or by using the keyword search tool below to find specific information within the annual report.-
 1
1 -
2
-
3
-
4
-
5
-
6
-
7
-
8
-
9
-
10
-
11
-
12
-
13
-
14
-
15
-
16
-
17
-
18
-
19
-
20
-
21
-
22
-
23
-
24
-
25
-
26
-
27
-
28
-
29
-
30
-
31
-
32
-
33
-
34
-
35
-
36
-
37
-
38
-
39
-
40
-
41
-
42
-
43
-
44
-
45
-
46
-
47
-
48
-
49
-
50
-
51
-
52
-
53
-
54
-
55
-
56
-
57
-
58
-
59
-
60
-
61
-
62
-
63
-
64
-
65
-
66
-
67
-
68
-
69
-
70
-
71
-
72
-
73
-
74
-
 75
75 -
 76
76 -
 77
77 -
 78
78 -
 79
79 -
 80
80 -
 81
81 -
 82
82 -
 83
83 -
 84
84 -
 85
85 -
 86
86 -
 87
87 -
 88
88 -
 89
89 -
 90
90 -
 91
91 -
 92
92 -
 93
93 -
 94
94 -
 95
95 -
96
-
97
-
98
-
99
-
100
-
101
-
102
-
103
-
104
-
105
-
106
-
107
-
108
-
109
-
110
-
111
-
112
-
113
-
114
-
115
-
116
-
117
-
118
-
119
-
120
-
121
-
122
-
123
-
124
-
125
-
126
-
127
-
128
-
129
-
130
-
131
-
132
-
133
-
134
-
135
-
136
-
137
-
138
-
139
-
140
 |
 |

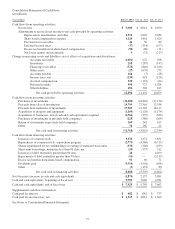
Consolidated Statements of Cash Flows
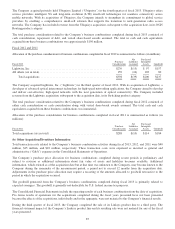
(in millions)
Years Ended July 27, 2013 July 28, 2012 July 30, 2011
Cash flows from operating activities:
Net income ............................................................ $ 9,983 $ 8,041 $ 6,490
Adjustments to reconcile net income to net cash provided by operating activities:
Depreciation, amortization, and other ................................... 2,351 2,602 2,486
Share-based compensation expense .................................... 1,120 1,401 1,620
Provision for receivables ............................................. 44 50 89
Deferred income taxes ............................................... (37) (314) (157)
Excess tax benefits from share-based compensation ........................ (92) (60) (71)
Net losses (gains) on investments ...................................... 9(31) (213)
Change in operating assets and liabilities, net of effects of acquisitions and divestitures:
Accounts receivable ............................................. (1,001) 272 298
Inventories .................................................... 218 (287) (147)
Financing receivables ........................................... (723) (846) (1,616)
Other assets ................................................... (27) (674) 275
Accounts payable ............................................... 164 (7) (28)
Income taxes, net ............................................... (239) 418 (156)
Accrued compensation .......................................... 330 (101) (64)
Deferred revenue ............................................... 598 727 1,028
Other liabilities ................................................ 196 300 245
Net cash provided by operating activities ........................ 12,894 11,491 10,079
Cash flows from investing activities:
Purchases of investments ................................................. (36,608) (41,810) (37,130)
Proceeds from sales of investments ......................................... 14,799 27,365 17,538
Proceeds from maturities of investments .................................... 17,909 12,103 18,117
Acquisition of property and equipment ...................................... (1,160) (1,126) (1,174)
Acquisition of businesses, net of cash and cash equivalents acquired .............. (6,766) (375) (266)
Purchases of investments in privately held companies .......................... (225) (380) (204)
Return of investments in privately held companies ............................ 209 242 163
Other ................................................................ 74 166 22
Net cash used in investing activities ............................ (11,768) (3,815) (2,934)
Cash flows from financing activities:
Issuances of common stock ............................................... 3,338 1,372 1,831
Repurchases of common stock—repurchase program .......................... (2,773) (4,560) (6,713)
Shares repurchased for tax withholdings on vesting of restricted stock units ......... (330) (200) (183)
Short-term borrowings, maturities less than 90 days, net ........................ (20) (557) 512
Issuances of debt, maturities greater than 90 days ............................. 24 — 4,109
Repayments of debt, maturities greater than 90 days ........................... (16) — (3,113)
Excess tax benefits from share-based compensation ............................ 92 60 71
Dividends paid ......................................................... (3,310) (1,501) (658)
Other ................................................................ (5) (153) 80
Net cash used in financing activities ............................ (3,000) (5,539) (4,064)
Net (decrease) increase in cash and cash equivalents ............................... (1,874) 2,137 3,081
Cash and cash equivalents, beginning of fiscal year ................................ 9,799 7,662 4,581
Cash and cash equivalents, end of fiscal year ..................................... $ 7,925 $ 9,799 $ 7,662
Supplemental cash flow information:
Cash paid for interest ........................................................ $ 682 $ 681 $ 777
Cash paid for income taxes, net ................................................ $ 1,519 $ 2,014 $ 1,649
See Notes to Consolidated Financial Statements.
77