Cisco 2013 Annual Report Download - page 66
Download and view the complete annual report
Please find page 66 of the 2013 Cisco annual report below. You can navigate through the pages in the report by either clicking on the pages listed below, or by using the keyword search tool below to find specific information within the annual report.-
 1
1 -
2
-
3
-
4
-
5
-
6
-
7
-
8
-
9
-
10
-
11
-
12
-
13
-
14
-
15
-
16
-
17
-
18
-
19
-
20
-
21
-
22
-
23
-
24
-
25
-
26
-
27
-
28
-
29
-
30
-
31
-
32
-
33
-
34
-
35
-
36
-
37
-
38
-
39
-
40
-
41
-
42
-
43
-
44
-
45
-
46
-
47
-
48
-
49
-
50
-
51
-
52
-
53
-
54
-
55
-
 56
56 -
 57
57 -
 58
58 -
 59
59 -
 60
60 -
 61
61 -
 62
62 -
 63
63 -
 64
64 -
 65
65 -
 66
66 -
 67
67 -
 68
68 -
 69
69 -
 70
70 -
 71
71 -
 72
72 -
 73
73 -
 74
74 -
 75
75 -
 76
76 -
77
-
78
-
79
-
80
-
81
-
82
-
83
-
84
-
85
-
86
-
87
-
88
-
89
-
90
-
91
-
92
-
93
-
94
-
95
-
96
-
97
-
98
-
99
-
100
-
101
-
102
-
103
-
104
-
105
-
106
-
107
-
108
-
109
-
110
-
111
-
112
-
113
-
114
-
115
-
116
-
117
-
118
-
119
-
120
-
121
-
122
-
123
-
124
-
125
-
126
-
127
-
128
-
129
-
130
-
131
-
132
-
133
-
134
-
135
-
136
-
137
-
138
-
139
-
140
 |
 |

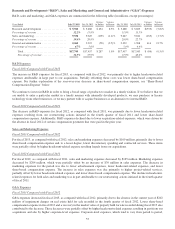
included operational infrastructure activities such as IT project implementations, which included investments in our global data
center infrastructure, and investments related to operational and financial systems.
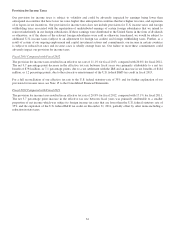
Fiscal 2012 Compared with Fiscal 2011
G&A expenses increased in fiscal 2012, as compared with fiscal 2011, primarily due to a net increase of approximately
$300 million in real estate charges, primarily for impairments on real estate held for sale, followed by other increased
corporate-level expenses. The increase in real estate charges in fiscal 2012 was primarily due to charges of $202 million
recorded in the fourth quarter of fiscal 2012. These increased corporate-level expenses, which tend to vary from period to
period, include increases related to our operational infrastructure such as real estate; IT project implementations, which include
further investments in our global data center infrastructure, and investments related to operational and financial systems.
Partially offsetting these increases were lower share-based compensation expense, and lower headcount-related expenses due
to the restructuring actions initiated in the fourth quarter of fiscal 2011.
Effect of Foreign Currency
In fiscal 2013, foreign currency fluctuations, net of hedging, decreased the combined R&D, sales and marketing, and G&A
expenses by $227 million, or approximately 1.3%, compared with fiscal 2012. In fiscal 2012, foreign currency fluctuations, net
of hedging, increased the combined R&D, sales and marketing, and G&A expenses by $90 million, or approximately 0.5%,
compared with fiscal 2011.
Headcount
Fiscal 2013 Compared with Fiscal 2012
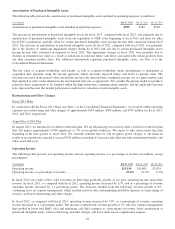
Our headcount increased by 8,410 employees in fiscal 2013. The increase was attributable to the headcount from acquisitions,
the largest of which was NDS, as well as targeted hiring in engineering and services.
In August 2013, we announced that we are rebalancing our resources with a workforce reduction plan that will impact
approximately 4,000 employees or 5% of our global workforce. See Note 5 to the Consolidated Financial Statements.
Fiscal 2012 Compared with Fiscal 2011
Our headcount decreased by 5,186 employees in fiscal 2012. The decrease was attributable to headcount reductions from the
completion of the sale of our Juarez, Mexico manufacturing operations and from our restructuring actions initiated in July
2011. Partially offsetting these declines in headcount were headcount increases due to the growth of our service business and
targeted hiring in engineering, which includes the hiring of recent university graduates.
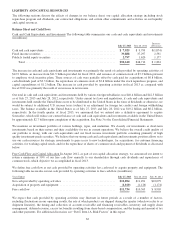
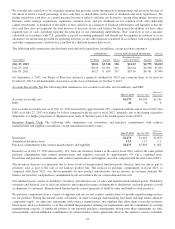
Share-Based Compensation Expense
The following table presents share-based compensation expense (in millions):
Years Ended July 27, 2013 July 28, 2012 July 30, 2011
Cost of sales—product ................................................... $40 $53 $61
Cost of sales—service ................................................... 138 156 177
Share-based compensation expense in cost of sales ............................. 178 209 238
Research and development ................................................ 286 401 481
Sales and marketing ..................................................... 484 588 651
General and administrative ................................................ 175 203 250
Restructuring and other charges ............................................ (3) ——
Share-based compensation expense in operating expenses ....................... 942 1,192 1,382
Total share-based compensation expense .................................... $1,120 $1,401 $1,620
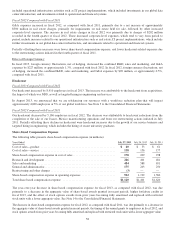
The year-over-year decrease in share-based compensation expense for fiscal 2013, as compared with fiscal 2012, was due
primarily to a decrease in the aggregate value of share-based awards granted in recent periods, higher forfeiture credits in
fiscal 2013, and the effect of stock options awards from prior years becoming fully amortized and replaced with restricted
stock units with a lower aggregate value. See Note 14 to the Consolidated Financial Statements.
The decrease in share-based compensation expense for fiscal 2012, as compared with fiscal 2011, was due primarily to a decrease in
the aggregate value of share-based awards granted in recent periods, the timing of the annual grants to employees in fiscal 2012, and
stock options awards from prior years becoming fully amortized and replaced with restricted stock units with a lower aggregate value.
58