Cisco 2013 Annual Report Download - page 101
Download and view the complete annual report
Please find page 101 of the 2013 Cisco annual report below. You can navigate through the pages in the report by either clicking on the pages listed below, or by using the keyword search tool below to find specific information within the annual report.-
 1
1 -
2
-
3
-
4
-
5
-
6
-
7
-
8
-
9
-
10
-
11
-
12
-
13
-
14
-
15
-
16
-
17
-
18
-
19
-
20
-
21
-
22
-
23
-
24
-
25
-
26
-
27
-
28
-
29
-
30
-
31
-
32
-
33
-
34
-
35
-
36
-
37
-
38
-
39
-
40
-
41
-
42
-
43
-
44
-
45
-
46
-
47
-
48
-
49
-
50
-
51
-
52
-
53
-
54
-
55
-
56
-
57
-
58
-
59
-
60
-
61
-
62
-
63
-
64
-
65
-
66
-
67
-
68
-
69
-
70
-
71
-
72
-
73
-
74
-
75
-
76
-
77
-
78
-
79
-
80
-
81
-
82
-
83
-
84
-
85
-
86
-
87
-
88
-
89
-
90
-
 91
91 -
 92
92 -
 93
93 -
 94
94 -
 95
95 -
 96
96 -
 97
97 -
 98
98 -
 99
99 -
 100
100 -
 101
101 -
 102
102 -
 103
103 -
 104
104 -
 105
105 -
 106
106 -
 107
107 -
 108
108 -
 109
109 -
 110
110 -
 111
111 -
112
-
113
-
114
-
115
-
116
-
117
-
118
-
119
-
120
-
121
-
122
-
123
-
124
-
125
-
126
-
127
-
128
-
129
-
130
-
131
-
132
-
133
-
134
-
135
-
136
-
137
-
138
-
139
-
140
 |
 |

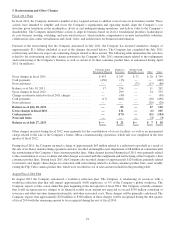
7. Financing Receivables and Guarantees
(a) Financing Receivables
Financing receivables primarily consist of lease receivables, loan receivables, and financed service contracts and other. Lease
receivables represent sales-type and direct-financing leases resulting from the sale of the Company’s and complementary
third-party products and are typically collateralized by a security interest in the underlying assets. Loan receivables represent
financing arrangements related to the sale of the Company’s products and services, which may include additional funding for
other costs associated with network installation and integration of the Company’s products and services. Lease receivables
consist of arrangements with terms of four years on average, while loan receivables generally have terms of up to three years.
The financed service contracts and other category includes financing receivables related to technical support and advanced
services, as well as receivables related to financing of certain indirect costs associated with leases. Revenue related to the
technical support services is typically deferred and included in deferred service revenue and is recognized ratably over the
period during which the related services are to be performed, which typically ranges from one to three years.
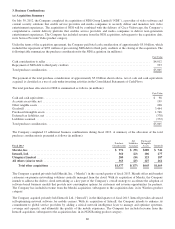
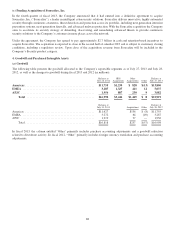
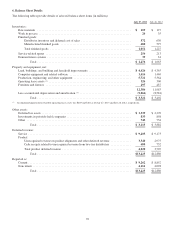
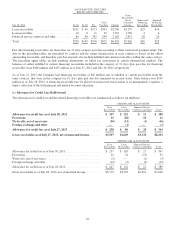
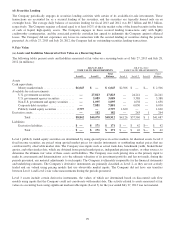
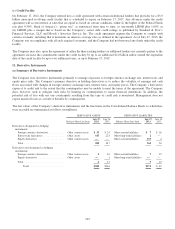
A summary of the Company’s financing receivables is presented as follows (in millions):
July 27, 2013
Lease
Receivables
Loan
Receivables
Financed Service
Contracts
and Other
Total Financing
Receivables
Gross ....................................... $3,780 $1,649 $3,136 $8,565
Unearned income ............................. (273) — — (273)
Allowance for credit loss ....................... (238) (86) (20) (344)
Total, net ............................ $3,269 $1,563 $3,116 $7,948
Reported as:
Current ................................. $1,418 $ 898 $1,721 $4,037
Noncurrent .............................. 1,851 665 1,395 3,911
Total, net ............................ $3,269 $1,563 $3,116 $7,948
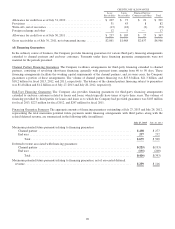
July 28, 2012
Lease
Receivables
Loan
Receivables
Financed Service
Contracts
and Other
Total
Financing
Receivables
Gross ........................................ $3,429 $1,796 $2,651 $7,876
Unearned income .............................. (250) — — (250)
Allowance for credit loss ........................ (247) (122) (11) (380)
Total, net ............................. $2,932 $1,674 $2,640 $7,246
Reported as:
Current .................................. $1,200 $ 968 $1,493 $3,661
Noncurrent ............................... 1,732 706 1,147 3,585
Total, net ............................. $2,932 $1,674 $2,640 $7,246
As of July 27, 2013 and July 28, 2012, the deferred service revenue related to the financed service contracts and other was
$2,036 million and $1,838 million, respectively.
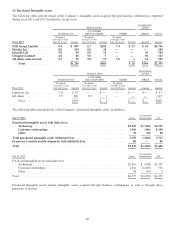
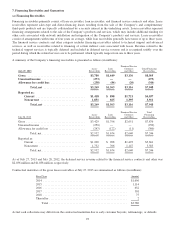
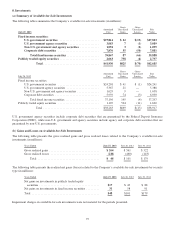
Contractual maturities of the gross lease receivables at July 27, 2013 are summarized as follows (in millions):
Fiscal Year Amount
2014 ......................................................... $1,656
2015 ......................................................... 1,114
2016 ......................................................... 632
2017 ......................................................... 301
2018 ......................................................... 75
Thereafter ..................................................... 2
Total ..................................................... $3,780
Actual cash collections may differ from the contractual maturities due to early customer buyouts, refinancings, or defaults.
93